Key Takeaways ETHFI’s pullback brings support near $0.70 into focus. A failed support reclaim would signal further weakness. Revenue-funded buybacks purchase tokens without permanently burnin
Key Takeaways
- ETHFI’s pullback brings support near $0.70 into focus.
- A failed support reclaim would signal further weakness.
- Revenue-funded buybacks purchase tokens without permanently burning them.
After failing to hold the move toward $0.81–$0.82, ETHFI traded near $0.733 on Coinbase’s daily chart at 14:07 UTC on October 1. The open candle showed a decline of about 6.5%, with the final daily result still dependent on where the session closes.
That retreat brings the lower boundary of its rising formation into focus. Pullbacks can occur during an uptrend, but a rebound from this boundary would provide firmer evidence that buyers are defending the advance than the size of the decline alone.
How Ether.fi’s expansion connects to ETHFI
Ether.fi’s business has been broadening beyond restaking, with its August 13 app release adding tokenized asset trading, portfolio-backed borrowing and payment connections. Those services underpin its crypto neobank branding, although Ether.fi states that it is not a bank.
The expansion accompanies a retreat from EigenLayer restaking, where CEO Mike Silagadze cited weak additional yields and perceived risks in September 28 reporting. That change concerns the extra restaking layer; ordinary Ethereum staking remains available through eETH and weETH.
Product activity connects to ETHFI through the buyback programme, which uses withdrawal fees and part of protocol revenue to purchase tokens. Coindoo’s earlier analysis of crypto gainers and their fundamentals also examined this link between Ether.fi’s usage and token demand. However, acquired tokens go to stakers or liquidity rather than being permanently burned, leaving them available for later sale.
Brokerage access is also expanding through the physically backed ETHFI ETP launched by 21Shares on September 22. Its effect on demand depends on investor purchases, so the listing alone cannot explain the rally. The immediate price test remains whether buyers hold the ground gained.
The first support test sits near $0.70
The lower blue trendline marks that test around $0.69–$0.70 at the October 1 candle, with its position rising over time. A pullback here would revisit support within the existing advance, rather than retest a confirmed breakout above the upper boundary.
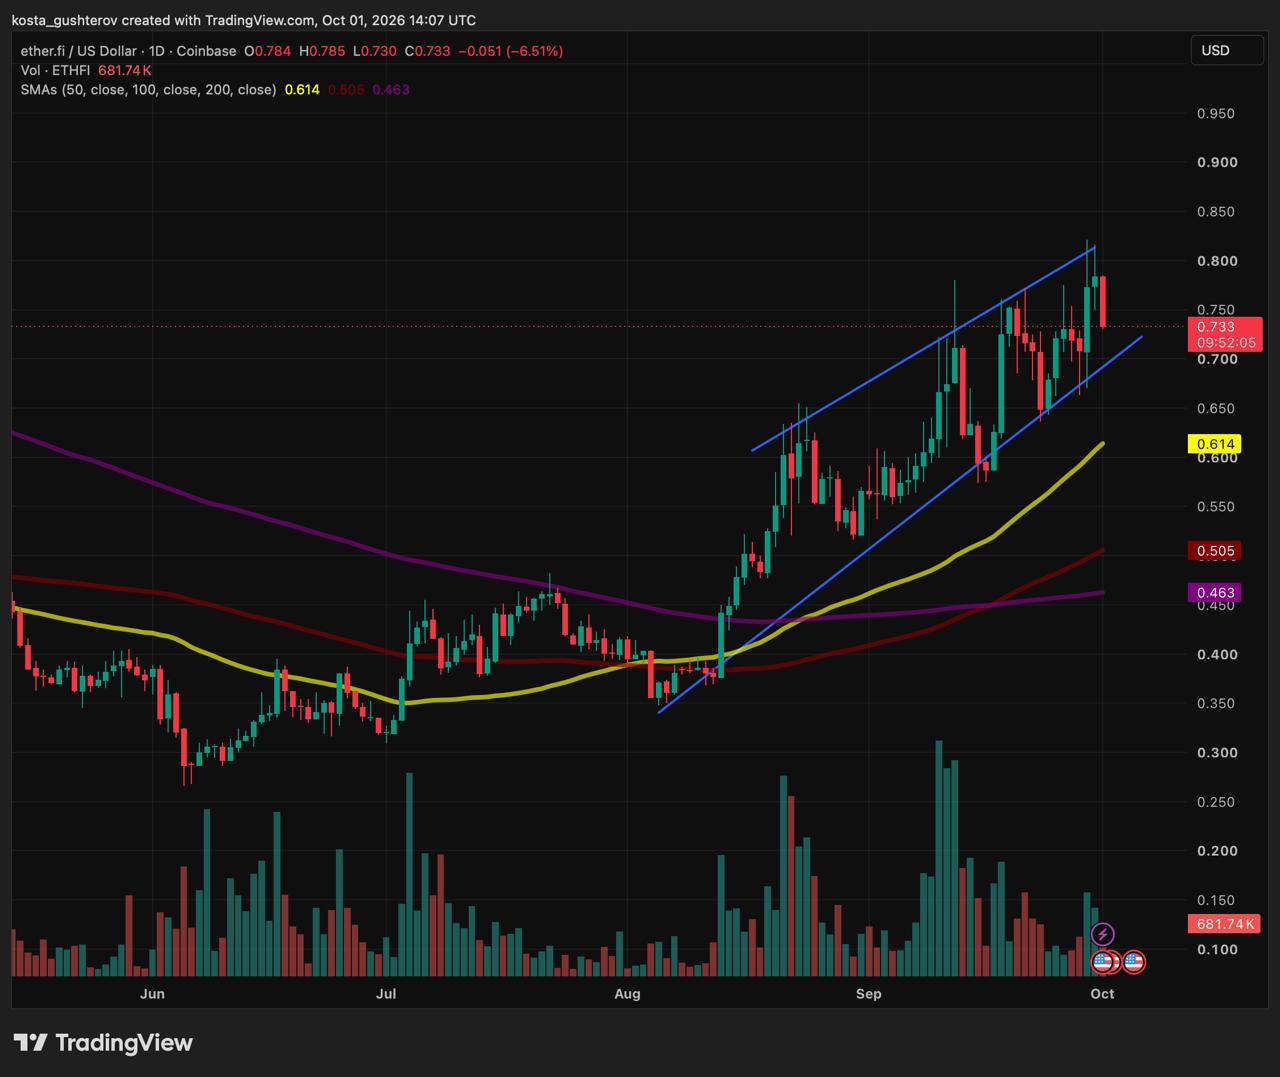
The lower blue trendline marks that test around $0.69-$0.70 at the October 1 candle, with its position rising over time. A pullback here would revisit support within the existing advance, rather than retest a confirmed breakout above the upper boundary.
ETHFI area
Support reference
$0.69–$0.70
Rising lower trendline at the chart’s timestamp.
$0.64–$0.65
Recent September swing-low area.
$0.61–$0.62
50-day simple moving average near $0.614.
$0.58–$0.60
Earlier September lows.
If ETHFI tests the trendline, closes above it and sustains a rebound, buyers would have a basis for recovering $0.75–$0.78. Holding that area would then strengthen the case for another attempt at the rejected $0.81–$0.82 zone.
A close below the line followed by a failed reclaim would instead suggest that former support is resisting rebounds. Losing $0.64–$0.65 afterward would break a recent higher low and bring the 50-day average into focus. Because that average follows past closing prices, it is a trend reference rather than a guaranteed floor.
READ MORE:
 DogeOS Opens a Testnet: What Could Change for DOGE Holders?
RSI can help assess the strength of a rebound
Alongside those price tests, the relative strength index can help assess momentum by comparing recent gains with losses, usually over 14 periods. This chart has no RSI panel, so it cannot establish a current reading or divergence.
If RSI falls from above 70 but holds above 50 while price defends support, that would be consistent with cooling momentum within the advance. A sustained move below 50 alongside a support break would reinforce weakness. On a later rebound, a higher price high paired with a lower RSI high would also warn that momentum is fading.
The next rebound therefore matters more than an immediate return to the highs. A recovery that holds after the initial bounce would show buyers accepting higher prices again; repeated rejection below lost support would point toward a deeper correction.
The post ETHFI Falls 6% After Yesterday’s Rally: Key Levels to Watch appeared first on Coindoo.