FWA trades near $0.01644, up 44.8% over 24 hours as of September 18, 2026, 12:00 UTC. The Fake World Assets price prediction conversation is heating up. Momentum leans bullish, with resistanc
FWA trades near $0.01644, up 44.8% over 24 hours as of September 18, 2026, 12:00 UTC. The Fake World Assets price prediction conversation is heating up. Momentum leans bullish, with resistance close to $0.01717 and support near $0.0101. Traders scanning theprice prediction hub will notice: this move didn't come from nowhere.
What changed? Volume spiked alongside the rally, pushing 24-hour turnover to roughly $1.077M against a $16.916M market cap, per CoinGecko. That's a lot of churn for a token this small.
Fake World Assets Price Prediction: Quick Outlook
Metric
Current View
FWA Price
$0.01644
24H Change
+44.8%
Trend
Bullish, short-term
Next Target
$0.01717 (24h high)
Support
~$0.0101
Resistance
~$0.01717, then $0.04613
RSI
53.99 (neutral, leaning up)
Bull Case
Break and hold above $0.01717
Base Case
Range-bound between $0.0101 and $0.01717
Bear Case
Loss of $0.0101 support
Invalidation
Sustained trading below $0.0101
That's the surface picture. What sits underneath matters more.
Similar setups turn up often inexchange listing trends coverage.
What Is Fake World Assets, and How Does FWA Work?
Fake World Assets runs on Ethereum, the blockchain network behind smart contracts. FWA connects to an NFT acquisition mechanism, where ETH-backed positions get built against specific NFTs.
Selection isn't manual. It uses Chainlink VRF, a verifiable randomness service that decides which items get pulled from a pool.
The FWA token plays a role in rewards and buybacks tied to this system. It trades through a Uniswap v4 market, the newest version of a decentralized exchange. Updates from TokenWorks describe pooled purchases and a mechanism pausing main-pool buying every 12 hours for 15 minutes.
Structures like this often overlap withairdrop reward programs.
FWA Price Analysis: Trend, RSI, and Momentum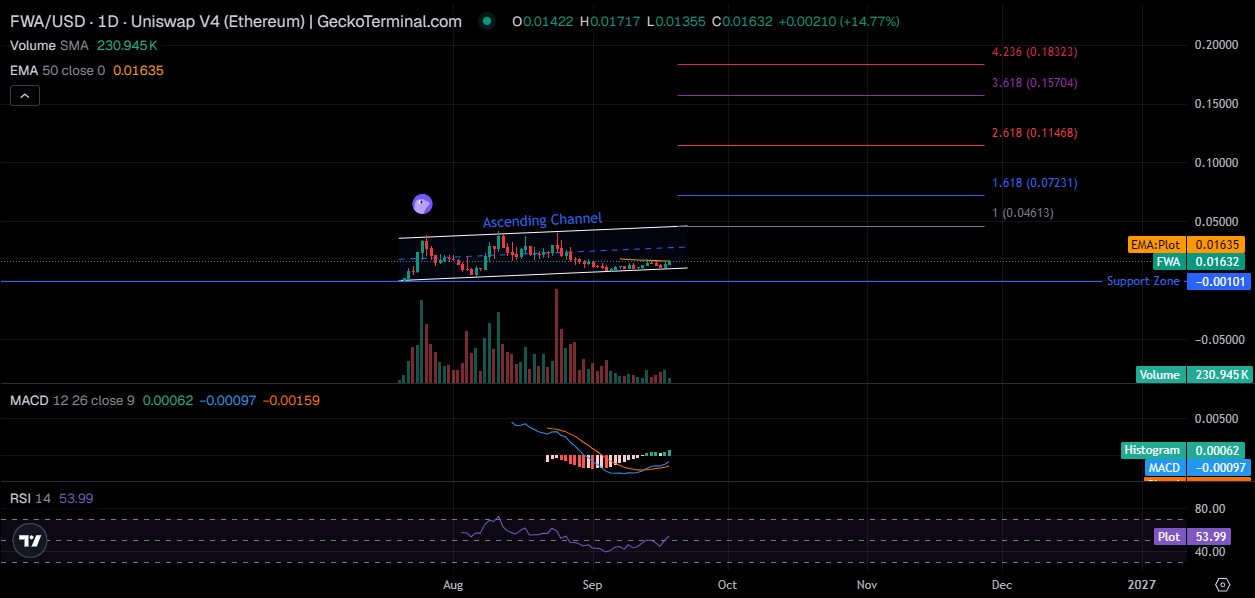
FWA Trend Structure
The daily chart shows an ascending channel from early August through mid-September, with higher lows forming inside it even as trading stayed choppy mid-stretch.
But the 50-period EMA sits at $0.01635, almost exactly where trading sits now. That's tight. Which side of that average trading settles on will say a lot about what comes next.
Setups like this get discussed inmemecoin market coverage too.
What RSI Says About FWA
RSI, or Relative Strength Index, measures how stretched a move is on a scale of zero to 100. FWA's daily RSI reads 53.99.
That's neutral. Not overbought, not oversold. Turns out, RSI cooled off from an earlier peak, hinting at fading momentum even as trading spiked. No clean divergence stands out yet.
MACD and Momentum Confirmation
MACD tracks two moving averages using a main line, a signal line, and a histogram. FWA's MACD line sits at negative 0.00097, below the signal line, with a histogram reading of 0.00062.
That histogram has been climbing off its recent low. It hasn't crossed positive yet. So momentum is improving, but it hasn't confirmed the breakout.
$FWA Support and Resistance Levels
Key $FWA Support
Immediate support sits around $0.0101, matching a marked chart zone. Secondary support runs near the base of the ascending channel, where trading bottomed in August.
A major breakdown level would be $0.003979, the all-time low from August 6, 2026.
Key $FWA Resistance
Immediate resistance sits at $0.01717, the current 24-hour high. Beyond that, the breakout level lines up with the channel top, near $0.02. The next real target, per the Fibonacci extension on the chart, is $0.04613.
$FWA Invalidation Level
A sustained break above $0.01717 would strengthen the upside case. A loss of $0.0101, though, would invalidate that setup and open the door toward support near the all-time low.
Checking acrypto events calendar alongside these levels can help.
Fake World Assets Price Prediction 2026
For 2026, the base sits between $0.015 and $0.03, assuming volume holds and the ascending channel stays intact. Bull stretches toward $0.045, matching the first Fibonacci extension near $0.04613.
Bear drops back toward $0.006 to $0.010 if support fails. This assumes no major shift in Ethereum-wide sentiment. Invalidation for the bullish case is a close below $0.0101.
Shifts like this often surface first inAI-driven crypto coverage.
Fake World Assets Price Prediction 2027-2030
Using roughly 1 billion FWA tokens for scenario math, here's how the multi-year outlook breaks down.
Year
Bear Case
Base Case
Bull Case
Key Driver
2027
$0.005-$0.015
$0.020-$0.040
$0.050-$0.100
Adoption and liquidity
2028
$0.004-$0.015
$0.025-$0.060
$0.075-$0.150
Ecosystem growth
2029
$0.005-$0.020
$0.035-$0.080
$0.100-$0.250
Broader market cycle
2030
$0.005-$0.025
$0.050-$0.100
$0.150-$0.300
Long-term demand
These are scenario ranges, not expected prices. They show what $FWA would need to be worth at different market-cap levels, not what it will be worth.
$FWA Price Prediction 2027
A bear scenario implies a $5M to $15M market cap. Base sits at $20M to $40M. Bull reaches $50M to $100M.
For context, as per Etherscan, the current market cap is near $16.39M, close to CoinGecko's figure. Estimates vary; $FWA is young and thinly tracked.
FWA Price Prediction 2028
Bands rise here only if the thesis improves. Bear runs $4M to $15M, base climbs to $25M to $60M, and bull stretches to $75M to $150M. The key driver has to be real ecosystem growth, not just a rising tide across crypto.
Growth like this often lines up withnew exchange listings.
FWA Price Prediction 2029
Bear sits at $5M to $20M. Base moves to $35M to $80M. Bull climbs to $100M to $250M.
Can FWA justify a valuation above $100M through actual adoption? That question matters more than any single price target.
FWA Price Prediction 2030
Bear drops to $5M to $25M. Base lands at $50M to $100M. Bull tops out near $150M to $300M.
Simple math answers a common question here. At roughly 1 billion tokens, $0.10 times 1 billion equals $100M in market cap, not a billion-dollar valuation. Neither number needs the scale most assume.
What Could Drive the $FWA Price Higher?
Protocol growth through new NFT collections added to the pool would help. So would rising liquidity and trading activity on the Uniswap v4 pool. NFT ecosystem expansion, like the recent CryptoPunk v1-to-v2 shift, adds visible activity.
Token demand and buybacks tied to protocol revenue matter too. Broader Ethereum and crypto market conditions still set the ceiling. FWA doesn't move in isolation.
Demand like this often ties intoongoing airdrop campaigns.
What Could Push FWA Lower?
Liquidity deterioration tops the list for a token this size. A sharp market-wide selloff would hit FWA harder than larger coins. Supply pressure remains a risk too: holder concentration data shows the top 100 wallets controlling 66.10% of supply, with whales alone holding 39.87%.
Large-holder selling could move the price fast. So could smart-contract or protocol risks tied to the NFT-buying mechanism itself.
Patterns like this show up acrossbroader memecoin news often.
FWA Price Prediction Scenarios
Bull Case
$FWA holds above $0.01717, volume stays elevated, and ecosystem activity around the NFT pools keeps expanding without major holder exits.
Base Case
Trading stays range-bound between $0.0101 and $0.01717 while the market waits for a clearer catalyst.
Bear Case
Support at $0.0101 breaks, whale wallets reduce exposure, and trading volume fades toward pre-rally levels.
What Invalidates Each Scenario?
A daily close below $0.0101 kills the bull case. A daily close above $0.01717 on strong volume kills the bear case. Everything else sits in the base case until one line breaks.
Cross-referencingupcoming crypto events helps too.
$FWA Market Data and On-Chain Signals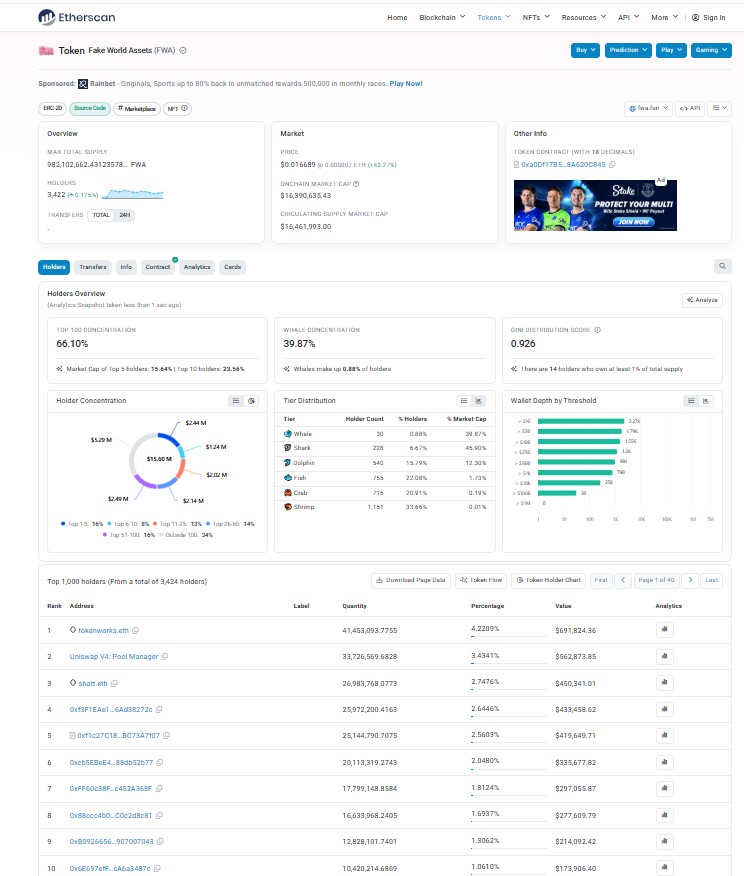
Market cap sits at $16.916M with a fully diluted valuation of $17.146M, per CoinGecko. The circulating supply runs 986.579 million tokens against a 1 billion max. Total value locked reads $895,680.
Holder count sits at 3,422 addresses, with a Gini score of 0.926, where higher numbers mean more concentration among fewer wallets. That score is high. Worth watching before assuming a rally reflects broad demand.
Data like this often gets flagged inAI crypto market news.
Trader Takeaway: What to Watch Next
Watch above: $0.01717
Confirmation: MACD histogram crossing positive
Resistance:$0.04613 as the next major technical target
Failure signal:A daily close back below the 50 EMA at $0.01635
Invalidation: Sustained trading under $0.0101
None of this guarantees direction. It just marks the lines that matter.
Similar setups get tracked infurther price prediction coverage.
Disclaimer
This article is for informational purposes only and does not constitute financial, investment, or trading advice. Cryptocurrency markets, especially low-capitalization tokens like FWA, carry high volatility and liquidity risk. Price scenarios described here are illustrative estimates based on publicly available data as of the stated timestamp and are not guarantees of future performance. Readers should conduct independent research before making financial decisions.