$Floki (FLOKI) has spent the better part of two years grinding through one of the meme coin sector's deepest drawdowns, and now that the monthly chart is flashing a fresh reversal off multi-y
$Floki (FLOKI) has spent the better part of two years grinding through one of the meme coin sector's deepest drawdowns, and now that the monthly chart is flashing a fresh reversal off multi-year lows, holders want a straight answer.
This Floki price prediction 2026–2050 breakdown is built to give exactly that, grounded in the levels the chart itself is showing, not just hopeful chatter on social media.
FLOKI Current Price Level
FLOKI is trading at $0.00002323 at the time of writing, up +8.10% on the month, after opening at $0.00002151 and printing a monthly high of $0.00002456 against a low of $0.00002105.
Price is sitting just above Support 1 and the secondary floor at $0.00002120 (Support 2), not far removed from the token's cycle low near $0.00001660.
This is the base any real forecast has to start from. The current price sits roughly 40% above the recent bottom but still more than 12x below the first major resistance overhead.
FLOKI has already lived through a brutal repricing from its 2024 cycle top, and figuring out how much of that lost ground can realistically get clawed back is really what this exercise comes down to.
Monthly Chart and Fibonacci Structure
The monthly chart shows $FLOKI carving out its swing low at the 0 Fibonacci level, priced at $0.00001660, with a long descending trendline drawn down from the prior cycle high through that low.
The price is currently sitting below this trendline; the breakout hasn't happened yet. Candles have chopped sideways to lower just under the line, testing the zone without a decisive monthly close above it.
A clean monthly close above the trendline would be the first real signal the downtrend structure is changing.
Until then, this reads as consolidation near the cycle low, not a confirmed reversal.
The projected move toward resistance 1, 2, and 3 on the chart is a bullish scenario contingent on that breakout, not something already in motion.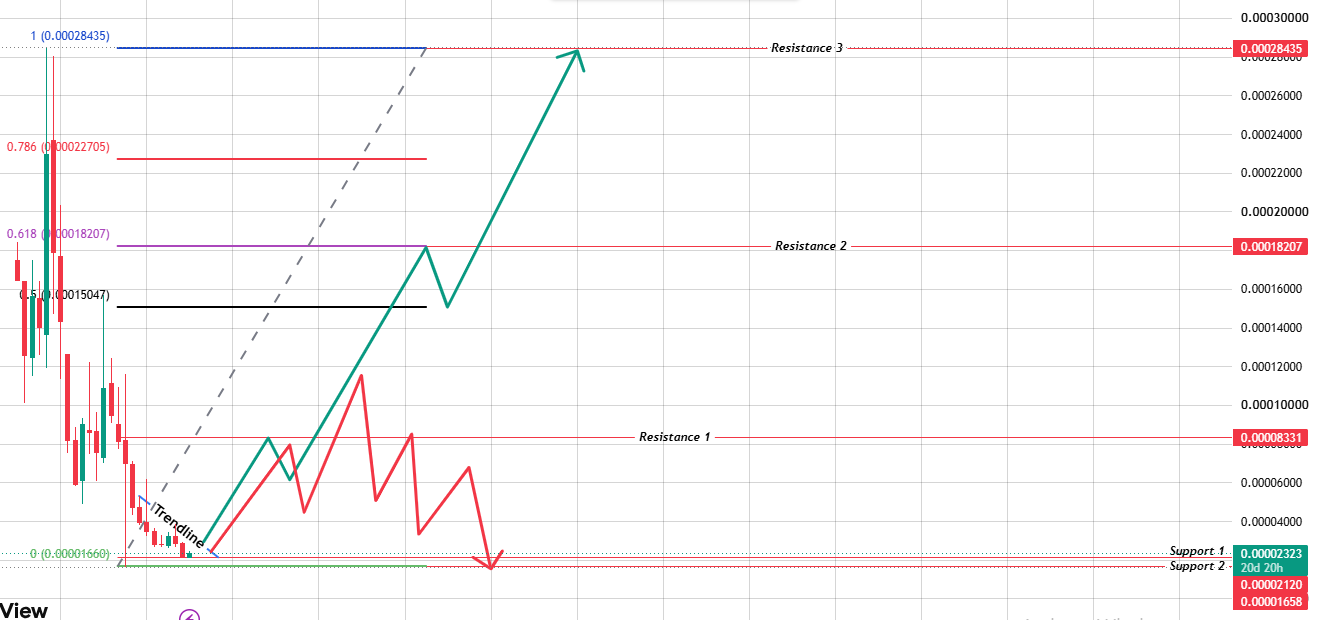
Source:Chart Taken From TradingView
From that swing low, the Fibonacci retracement drawn up toward the prior cycle high maps out a clean ladder of resistance levels:
Fibonacci LevelPrice TargetSignificance
Resistance 1$0.00008331First real test above the base, roughly 3.6x the current price.
0.5 Fib$0.00015047Mid-retracement resistance and psychological halfway point.
Resistance 2$0.00018207Confirms a genuine trend reversal if broken.
0.786 Fib$0.00022705Strong resistance below the 1.0 Fibonacci extension.
1.0 Fib / Resistance 3$0.00028435Full retracement matching the previous cycle resistance.
1.618 Extension$0.00044982First major long-term bullish extension target.
2.618 Extension$0.00071756Deep extension target for a multi-cycle bull run.
None of these are arbitrary lines. They're the same type of resistance ladder that's governed $FLOKI's price action since its all-time high, which is why any credible Floki price prediction for 2026–2050 has to be built level by level instead of pulled out of thin air.
Floki Price Prediction 2026–2030
Short-term, the outlook stays tied to whether the trendline breakout holds and whether broader meme coin sentiment stays supportive through the rest of 2026.
A confirmed monthly close above Resistance 1 at $0.00008331 would be the first sign this base is turning into a real uptrend, opening a path toward the 0.5 Fib level at $0.00015047 before year-end.
Carry that momentum into 2027 and 2028, and Resistance 2 at $0.00018207, followed by the 0.786 Fib at $0.00022705, becomes a realistic waypoint, assuming Bitcoin dominance eases and capital rotates back into meme coins.
By 2030, if FLOKI reclaims the 1.0 Fib level at $0.00028435 and holds it, that's a full retracement back to the token's prior major resistance, arguably the biggest milestone in the near-term half of this Floki price prediction 2026–2050 before the timeline stretches into more speculative territory.
Getting there still depends heavily on community demand staying strong enough to support that kind of sustained bid.
Floki Price Prediction 2035–2040
Stretching the timeline further out, the picture shifts from short-term momentum to whether $FLOKI's underlying ecosystem, the Valhalla gaming metaverse, the $FlokiFi DeFi suite, and the token locker product keep growing usage across multiple market cycles.
If $FLOKI clears the 1.0 Fib zone and pushes into the 1.618 extension near $0.00044982, that marks one of the largest multi-year recoveries the meme coin sector has produced from a drawdown this deep.
Getting there wouldn't happen in a straight line; expect sharp corrections along the way, mirroring the same volatility that defined the 2024–2026 decline.
By 2040, assuming continued token burns meaningfully shrink the circulating 10 trillion supply and FLOKI holds relevance as a top-tier community token.
Price levels somewhere between the 1.618 and 2.618 extensions, roughly $0.00045 to $0.0007, enter the realistic range for that decade, though nothing here is a guarantee.
Floki Price Prediction 2050
A 2050 figure has to be treated as a scenario exercise rather than a forecast. 24 years is far beyond what any chart-based model can reliably project, and this Floki price prediction 2026–2050 makes no claim otherwise.
Bearish scenario: FLOKI fails to sustain community relevance across multiple cycles, the trendline breakout fails, and price settles back into the $0.00001–$0.00003 range, similar to where many aging meme coins eventually land.
Base scenario: FLOKI holds its ecosystem together, burns continue, and price oscillates around the 1.0 to 1.618 Fib zone, landing somewhere between $0.0002 and $0.0005, arguably the single most likely outcome at this distance.
Bullish scenario: $FLOKI becomes one of the rare meme coins that survive and compound relevance across decades, clearing the 2.618 extension near $0.00071756 and, in an extreme "everything goes right" case, with aggressive multi-decade supply burns.
Mainstream adoption of Valhalla and $FlokiFi and repeated meme coin supercycles, stretching toward the $0.003–$0.005 zone by 2050.
This would represent roughly a 130x–215x move from current levels and would require demand, adoption, and deflationary supply pressure far beyond anything the token, or arguably the meme coin sector as a whole, has demonstrated to date. It should be treated as a long-shot ceiling scenario, not an expectation.
Floki (FLOKI) Price Prediction Target Table (2026–2050)YearBear CaseBase CaseBull Case
2026$0.0000180$0.00008331$0.000150472030$0.0000250$0.00018207$0.000284352040$0.00003$0.00035$0.000449822050$0.00002$0.0005$0.0050This table is the fastest way to scan every stage of this Floki price prediction 2026–2050 at once. Treat the upper end as a long-shot possibility rather than an expectation; these figures are illustrative scenarios anchored to the chart's own levels, not guaranteed outcomes.
Factors That Could Shape This Forecast
A handful of variables will decide whether $FLOKI leans toward the bearish or bullish end of this range over the coming decades.
Trendline confirmation matters first; whether the current breakout above the descending trendline holds on a monthly close basis will set the tone for everything that follows.
Ongoing supply burns are the second piece, since continued reduction of the 10 trillion token supply through ecosystem fees directly supports the higher end of the range.
Broader crypto market cycles play a role too. Bitcoin and Ethereum bull and bear phases tend to drag meme coins along with them, and $FLOKI won't be fully insulated from that pull.
Real ecosystem usage, through Valhalla, FlokiFi, and the token locker, would give the bullish case a stronger foundation than pure speculation.
And wider exchange listings and liquidity would help keep valuations more stable at whatever level this forecast eventually lands on.
Final Thoughts
$FLOKI's chart is finally showing the kind of structural change of a trendline breakout off a multi-year low that long-term holders have been waiting for since the 2024 top.
The Fibonacci ladder above current price gives a genuinely useful, level-by-level way to track whether that reversal is real or just another failed bounce.
Stretching that same logic out to 2050 means accepting a wide band of outcomes rather than one confident number.
Anyone using this Floki price prediction 2026–2050 breakdown should treat it as a research starting point, not financial advice.
Meme coin markets move on community energy and sentiment as much as they do on chart structure, and that won't change a decade or two from now.
Disclaimer: This article is for informational purposes only and should not be considered financial advice. Cryptocurrency investments, especially in high-volatility meme coins like $FLOKI, carry significant risk of loss. Always do your own research before investing.