FLOKI is running out of room. The price has been squeezed into a tighter and tighter space for weeks, and that kind of squeeze never lasts forever. This FLOKI price prediction looks at exactl
FLOKI is running out of room. The price has been squeezed into a tighter and tighter space for weeks, and that kind of squeeze never lasts forever.
This FLOKI price prediction looks at exactly where the walls are closing in and which way the price is more likely to break.
Current FLOKI Price and Where It Stands Right Now
$FLOKI is trading around $0.00002236 right now. It's a small number, but the setup behind it is worth paying attention to.
Two different charts are both pointing to the same tight zone, which is not something that happens by accident.
Social Sentiment Check: Wallet Access Over Hype
Social chatter around FLOKI right now isn't loud calls or bold predictions; it's about access.
Klever Wallet recently posted about being able to buy $FLOKI directly inside their app, framing it as freedom to buy on your own terms. 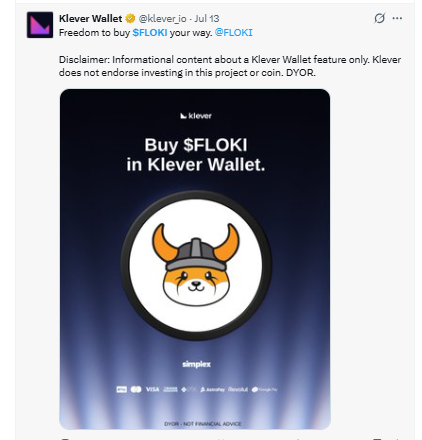
Source: Data Taken From X
The post carried a clear disclaimer too: it's informational only, and Klever isn't endorsing $FLOKI as an investment.
That's a quieter kind of signal than a bullish trader call, but it still matters.
Easier wallet access tends to widen who can actually buy a token, which can support demand over time even without a dramatic headline behind it.
It's not a breakout confirmation on its own, but it's one more small piece supporting the setup
FLOKI Liquidation Data: A Quiet Market Right Now
The liquidation heatmap for FLOKI is unusually calm at the moment.
Across the 1-hour, 4-hour, 12-hour, and 24-hour windows, total liquidations sit flat at $14.76 each time, and every bit of it is long-side shorts showing $0 across the board. 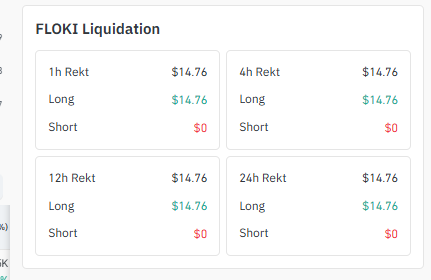
Source: Liquidation Data Taken From Coinglass
That's a very thin number compared to most tokens, and it says something on its own: nobody's getting forced out of positions right now, which usually means the market is waiting, not fighting.
A quiet liquidation chart like this often shows up right before a bigger move, simply because there isn't much leverage built up yet to get flushed out.
Worth watching closely once the price actually breaks the triangle or the channel; that's usually when this number starts to move.
Exchange Volume Heatmap: Where the Futures Action Is
BingX leads $FLOKI exchange volume at $1.33M, followed by MEXC at $836.68K and OKX at $730.97K. 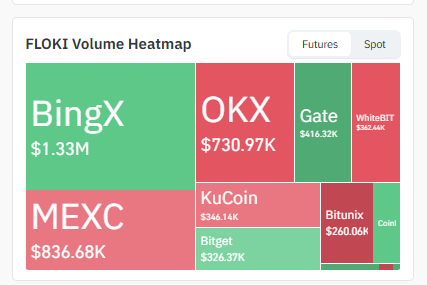
Source: Heatmap Data Taken From Coinglass
Gate ($416.32K), WhiteBIT ($362.44K), KuCoin ($346.14K), and Bitget ($326.37K) make up the middle tier, with Bitunix ($260.06K) and a couple of smaller venues trailing behind.
Total volume here is far lighter than what you'd see on a token like DOGE or SHIB, which fits FLOKI's smaller market size, but it also means price can move faster on comparatively lighter volume once the support zone or resistance actually breaks.
4H Chart: Descending Channel Still Holding FLOKI Down
Drop to the 4-hour chart, and there's a second pattern working against FLOKI right now: a descending channel, both lines sloping down together, boxing price in.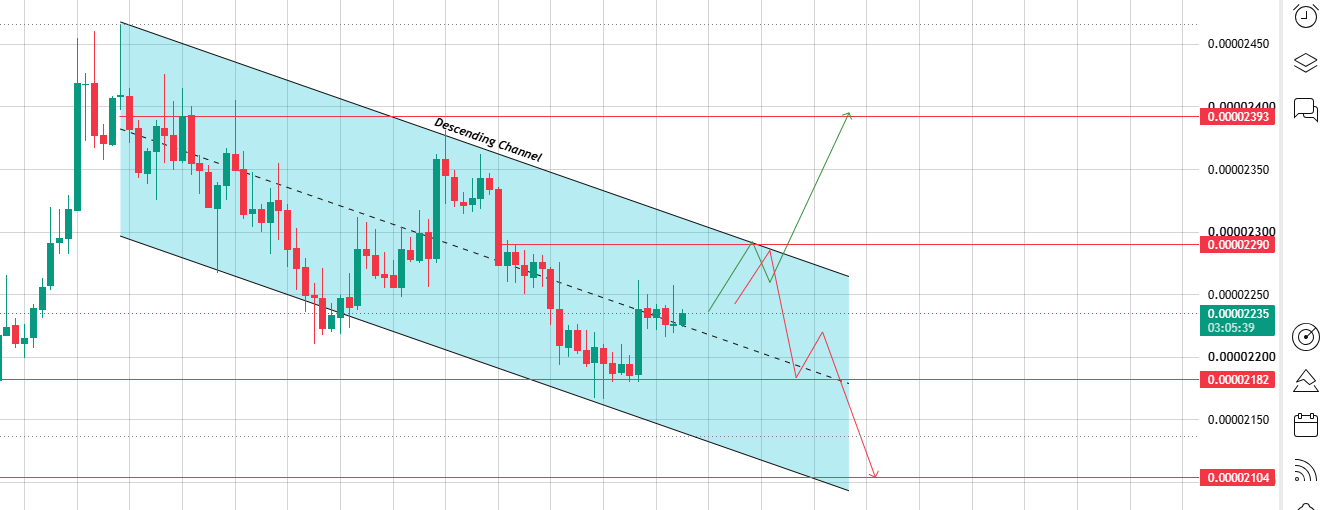
Source:Chart Taken From TradingView
$FLOKI is currently trading at $0.00002235, right around the middle of that channel.
A break above the channel opens the door to $0.00002290 first, then $0.00002393. If buyers keep control, notice that it lines up closely with the daily triangle's upside path too.
But a break below the channel could send the price to $0.00002182, with $0.00002104 as the next stop if the drop continues.
This channel has been the story on the 4-hour chart for a while now, and it still hasn't given way in either direction.
1D Chart: FLOKI's Symmetrical Triangle Nears the Apex
On the daily chart, FLOKI is inside a clean symmetrical triangle. The top line slopes down from the $0.000028 highs. 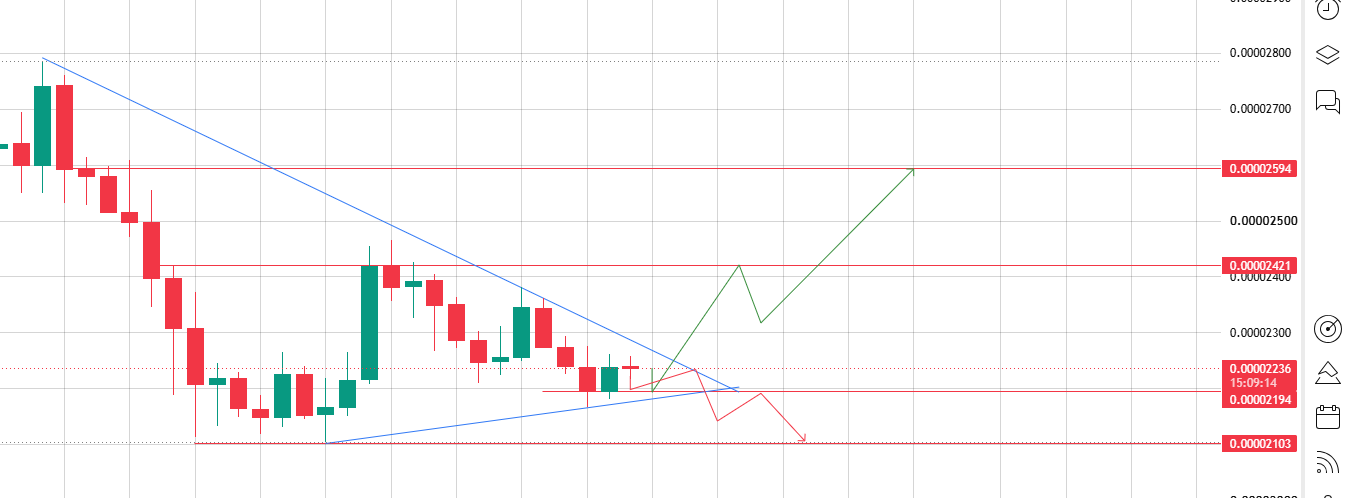
Source: Chart Taken From TradingView
The bottom line slopes up from the $0.000021 lows. Both lines are closing in on each other, and the price is now sitting right in the middle near $0.00002236, close to where the lines meet.
If the price breaks above the top line, $0.00002421 is the first resistance level to watch.
Clear that too, and $0.00002594 comes next; that would mark a real change in direction. But if the bottom line breaks instead, $0.00002194 gets tested first, with $0.00002103 next if sellers keep pushing.
A symmetrical triangle this tight usually doesn't drift. It tends to snap hard once one side wins.
FLOKI Three-Scenario Price Outlook: Bull, Bear, Neutral
Here's a simple table covering the bullish breakout case and the bearish breakdown risk side by side:
ScenarioTriggerPrice Target
Bullish BreakoutTriangle and channel both break upward through
$0.00002290–$0.00002421.
$0.00002594Neutral / Range-boundPrice stays trapped between
$0.00002194 and
$0.00002290.
$0.00002235–$0.00002290Bearish BreakdownTriangle and channel both break downward through
$0.00002182–$0.00002194.
$0.00002103Final Outlook: What Could Move FLOKI Off This Triangle
Put it together and FLOKI is genuinely coiled.
The daily symmetrical triangle and the 4-hour descending channel are both closing in at almost the same time, liquidations are flat and quiet, and volume is thin enough that a real breakout could move fast once it starts.
This is the kind of setup where patience usually pays off more than guessing early.
The bigger market will likely tip the scale. FLOKI, like most smaller meme tokens, tends to move harder when BTC dominance drops and money flows into altcoins, or rising Bitcoin gives this setup more room to break upward.
There's also an ETH correlation worth watching, since FLOKI's ecosystem leans on broader altcoin risk appetite, which often tracks Ethereum closely.
If BTC and ETH hold steady while FLOKI clears $0.00002290 and then $0.00002421, a push toward $0.00002594 becomes a realistic price target rather than just a hopeful one.
Disclaimer: This article is for informational purposes only and should not be taken as financial advice. Always do your own research before making investment decisions.