FLOKI showed up in 2021, named after Elon Musk's dog, riding the same meme wave that lifted a dozen copycats before most of them quietly disappeared. This one didn't disappear, though. It act
FLOKI showed up in 2021, named after Elon Musk's dog, riding the same meme wave that lifted a dozen copycats before most of them quietly disappeared.
This one didn't disappear, though. It actually built something around itself, a metaverse project, an NFT marketplace, and a media platform, more than most meme coins ever bother attempting.
So here's this month's FLOKI price prediction, a look at where $FLOKI stands right now, trading around $0.00002046, and what the chart seems to be setting up.
FLOKI Price Prediction: Live Market Data
$FLOKI currently sits at $0.00002046 and is up 1.2%.
Market cap comes in at $197.367M against a fully diluted valuation of $409.21M, so roughly half the eventual supply still hasn't hit circulation. 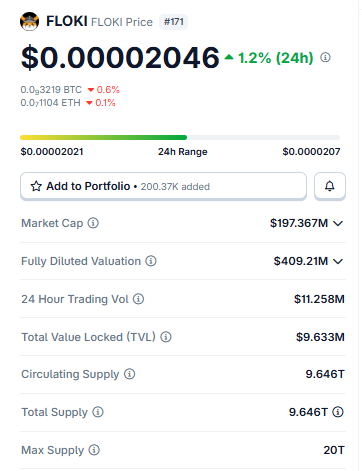
Source: Market Cap Data Taken From Coingecko, data as of Aug 04, 2026. Figures may vary slightly across other tracking websites.
Circulating and total supply match exactly at 9.646T, with a max cap of 20T sitting above that.
A daily volume of $11.258M keeps this market reasonably active, and a total value locked figure near $9.633M shows genuine DeFi usage around the token, not just speculation.
On-Chain and Market Drivers
The liquidation heatmap is oddly quiet for $FLOKI right now.
Total liquidations across the 1-hour, 4-hour, 12-hour, and 24-hour windows all sit at the exact same $375.64 figure, entirely on the long side, with zero shorts touched. 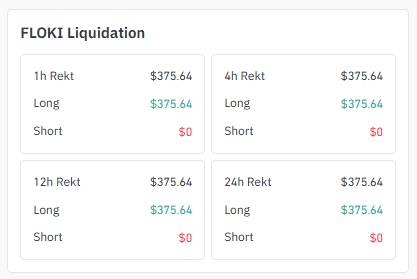
Source: Liquidation Data Taken From Coinglass.
That flat pattern across every timeframe basically means one small long position got wiped out recently, and nothing much has happened since.
No squeeze, no cascade, just quiet positioning, sitting there. Calm like this often precedes a bigger move once the wedge finally resolves one way or the other.
Exchange volume shows MEXC leading at $1.30M, with BingX close behind at $1.24M. 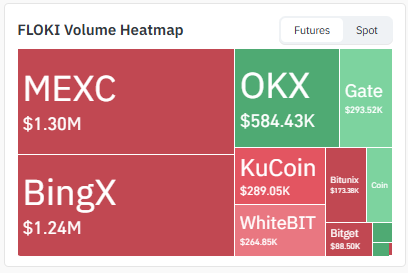
Source: Volume Heatmap Data Taken From Coinglass.
OKX contributes $584.43K, and smaller amounts trickle in from Gate, KuCoin, and WhiteBIT.
Spread this thin across several venues; liquidity here works fine for normal trading but stays thin enough that larger orders could still move price more than they would on a deeper market.
Key Takeaways
FLOKI is trading at $0.00002046, coiled inside a falling wedge on the daily chart.
Break above the wedge's upper boundary with volume and $0.00002420 opens up, then $0.00002764.
Lose the lower boundary instead, and the price likely slides to $0.00001781, then $0.00001544.
On the hourly chart, an ascending triangle is forming. Usually read as bullish continuation.
Liquidations have been almost nothing, just $375.64 total, entirely on the long side.
Technical Analysis Of Floki
1-Hour Chart Analysis
Drop to the hourly, and a different shape shows up, an ascending triangle, with flat resistance sitting on top while a rising support line pushes price toward it from below. 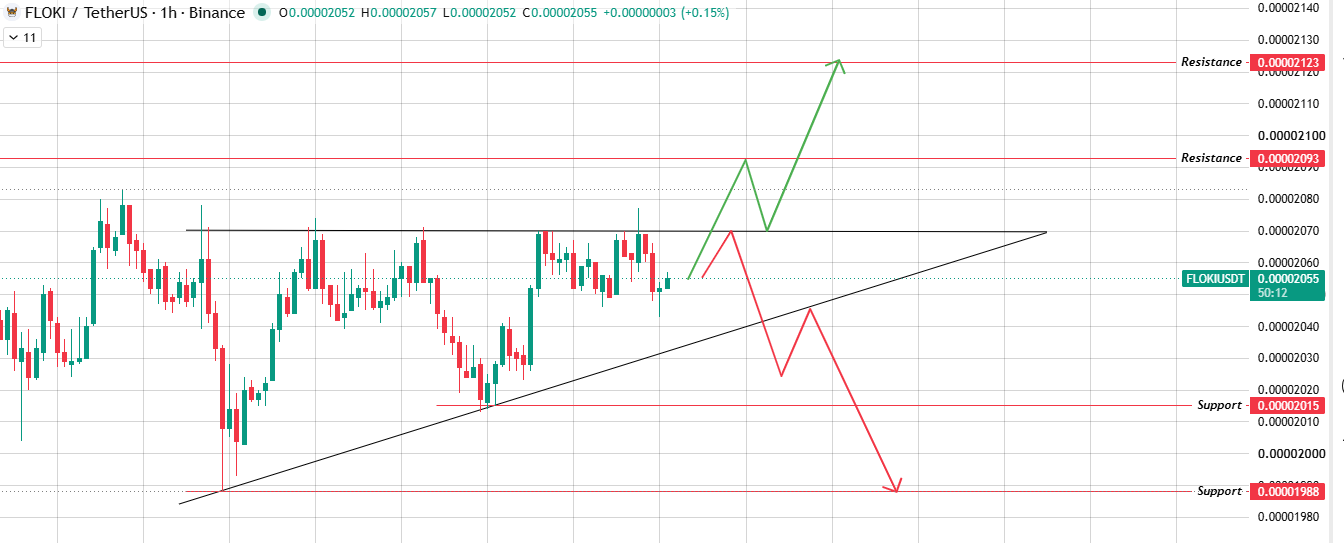
Source: Chart Taken From TradingView.
That setup usually gets read as bullish continuation, for good reason. If the price breaks out of this triangle and clears the resistance level at $0.00002093 with volume, then $0.00002123 will become the next level to watch.
If that rising support line gives out instead, the price would be expected to drop toward $0.00002015 and then $0.00001988 below that.
Triangles like this resolve upward more often than not, though nothing's guaranteed until it actually happens.
Daily Chart Analysis
$FLOKI have been squeezed into a falling wedge for weeks now, both boundaries sloping down together, the range getting tighter with every candle. 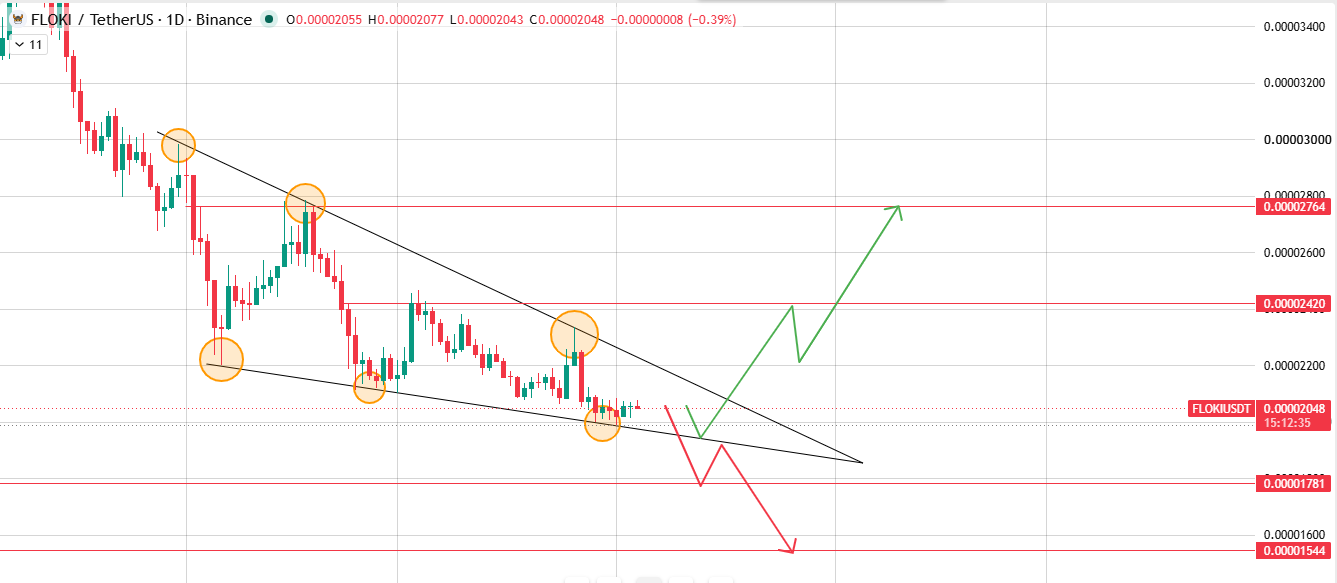
Source: Chart Taken From TradingView.
That's where things stand today: the price is sitting near the apex, decision time closing in.
Break above the upper boundary with real volume behind it, and the move should carry toward the resistance level at $0.00002420, with room to stretch further to $0.00002764 if momentum builds.
Break down through the lower boundary instead, and FLOKI likely falls back to the support zone at $0.00001781, then $0.00001544 underneath that if selling picks up. Falling wedges tend to lean bullish more often than not.
This one still needs to prove it either way.
Bull, Base, and Bear Case
ScenarioTriggerPrice TargetBullBreak above the falling wedge's upper boundary with strong volume.$0.00002420, extending to
$0.00002764BaseContinue trading inside the falling wedge.$0.00001781 – $0.00002420BearBreak below the falling wedge's lower boundary.
$0.00001544What breaks the bull case? Getting rejected at that upper trendline again, same as before. What breaks the bear case? Buyers are simply holding the lower boundary and not letting it snap.
Catalysts to Watch
The wedge breakout is the obvious catalyst behind this floki price prediction, but a few other things matter too.
Total value locked near $9.633M shows FLOKI's ecosystem still gets real usage beyond pure speculation, which can cushion price during broader pullbacks.
FLOKI's price target also tends to move with BTC dominance shifts, since meme coins generally need altcoin-friendly conditions to run at all.
ETH correlation is looser here given FLOKI runs its own ecosystem projects, but overall crypto sentiment still sets the backdrop either way.
Watch for volume expansion the moment the price nears either wedge boundary.
A move without volume behind it tends to fail fast.
Analyst Forecasts
There's no single headline call driving $FLOKI sentiment this cycle, but more a general read that the falling wedge structure is doing the talking on its own.
Wedge patterns like this one carry a statistical lean toward bullish resolution, which is exactly why traders are watching that upper boundary so closely right now.
The quiet liquidation data adds to the picture too. Without any recent short squeeze or long liquidation cascade skewing things one way, whatever move comes next probably reflects genuine positioning rather than a forced unwind.
Long-Term Outlook
Pull back further and FLOKI has managed something a lot of 2021-era meme coins never did.
It built real infrastructure around the token instead of coasting entirely on hype and community memes.
That TVL figure and the broader ecosystem give it a slightly different long-term case compared to pure meme plays sitting on nothing but a logo and a Twitter following.
Still, the price remains well below earlier cycle highs, and reclaiming that ground likely takes sustained volume over months, not a single wedge breakout candle.
Holding above the wedge's lower boundary on any pullback stays the level worth tracking here.
Glossary
Falling Wedge:Two downward-sloping trendlines squeezing together toward a point, often resolving with an upside break once price simply runs out of room to fall.
Ascending Triangle:Flat resistance sitting on top, rising support pushing up from below. Price gets pinched toward that flat line until it finally breaks through or gives up.
Support Zone / Resistance Level: Chart areas where buying or selling has shown up strong enough before to pause or reverse where price is heading.
Liquidation Heatmap:A map showing where over-leveraged longs and shorts get forced out as price crosses certain levels. Quiet map, quiet market, usually.
BTC Dominance: Bitcoin's slice of the total crypto market. Watch it drop and altcoins, meme coins included, tend to get more room to run.
Methodology:price levels sourced directly from 1D and 1H TradingView charts; liquidation and volume data sourced from Coinglass; no data extrapolated beyond visible chart structure.
Disclaimer: This article is for informational purposes only and does not constitute financial advice. Cryptocurrency markets, including FLOKI, are highly volatile and speculative. Price levels discussed are derived from technical chart analysis of TradingView data as of August 4, 2026, and are probability-based scenarios, not guarantees. Always conduct independent research and consult a licensed financial advisor before making investment decisions.