What to Know: FREYSA trades near $0.0026001, holding above the middle Bollinger Band at $0.0024490 as buyers strengthen their position. RSI stands at 55.75, indicating improving buying moment
What to Know:
- FREYSA trades near $0.0026001, holding above the middle Bollinger Band at $0.0024490 as buyers strengthen their position.
- RSI stands at 55.75, indicating improving buying momentum while remaining comfortably below the overbought threshold and leaving room for gains.
- Breaking $0.0027520 could strengthen FREYSA’s bullish structure, while sustained long-term demand may eventually support a move toward the $0.01 level.
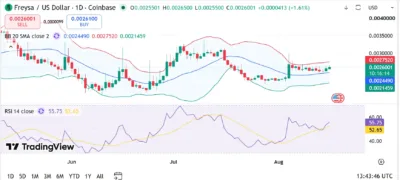
Freysa (FREYSA) is showing improving bullish momentum on the daily chart, with the token trading around $0.0026001 following a 1.61% gain. Price remains above the middle Bollinger Band at $0.0024490, indicating that buyers have maintained control of the short-term structure following the recovery from August lows.
The 14-day Relative Strength Index (RSI) stands at 55.75, while its moving average is around 52.65. Momentum therefore remains above the neutral 50 level without entering overbought territory, suggesting FREYSA still has room to extend its recovery if buying pressure strengthens.
Also Read: Syrup (SYRUP) Price Prediction 2026–2030: Can SYRUP Hit $0.50?
FREYSA Buyers Eye Upper Bollinger Band
FREYSA has established itself above the middle Bollinger Band at $0.0024490, which represents an important technical support area. Maintaining this level could allow buyers to challenge the upper Bollinger Band, currently positioned around $0.0027520.
A decisive breakout above $0.0027520 would strengthen the bullish setup and could open the path toward the psychological $0.0030000 region. The chart shows FREYSA previously trading above $0.0030000, making this area a notable resistance zone for any stronger recovery.
Meanwhile, the lower Bollinger Band stands near $0.0021459. A decline below the middle band at $0.0024490 could weaken the current momentum and increase the possibility of another test of this lower support.
The wider chart shows FREYSA recovering from its early-August weakness while volatility has narrowed considerably. Such compression can precede a stronger directional move, making the Bollinger Band boundaries particularly important for determining the next price trend.
Technical Outlook
Momentum indicators currently favor buyers moderately. FREYSA’s RSI at 55.75 sits above its moving average of 52.65, reflecting improving demand. However, the indicator remains well below the 70 level commonly associated with overbought conditions.
A sustained breakout above $0.0027520 could shift attention toward $0.0030000 and potentially the July highs around $0.0032000. Reclaiming those levels would provide stronger confirmation that the broader recovery is gaining momentum.
Conversely, rejection around the upper Bollinger Band could return FREYSA toward $0.0024490. Losing this middle band would place greater attention on $0.0021459, with a decisive breakdown potentially restoring bearish pressure.
Source; Tradingview
Freysa (FREYSA) Price Prediction (2026–2030)
YearMinimumAverageMaximum2026$0.0021$0.0028$0.00352027$0.0025$0.0036$0.00482028$0.0032$0.0048$0.00622029$0.0040$0.0062$0.00802030$0.0050$0.0075$0.0100
Price Forecast by Year
2026
If FREYSA maintains support above $0.0024490 and breaks the $0.0027520 upper Bollinger Band, stronger buying momentum could support an advance toward approximately $0.0035.
2027
Establishing the $0.0030 region as support could improve FREYSA’s broader technical structure and potentially allow buyers to challenge approximately $0.0048 under favorable market conditions.
2028
Sustained demand combined with higher highs and higher lows could strengthen the longer-term bullish structure, potentially supporting an advance toward the $0.0062 region.
2029
If buyers maintain control across longer timeframes and FREYSA attracts stronger market demand, the token could approach approximately $0.0080, although substantial appreciation would be required.
2030
A sustained long-term bullish structure could eventually place the psychological $0.01 level within reach. From $0.0026001, reaching $0.01 would require FREYSA to rise by roughly 285%.
Conclusion
Freysa is showing improving technical momentum, with its price around $0.0026001 holding above the middle Bollinger Band at $0.0024490. RSI at 55.75 further supports the bullish setup without indicating excessive buying pressure.
The immediate challenge remains the upper Bollinger Band around $0.0027520. Breaking this resistance could open the path toward $0.0030000 and potentially the July highs, while losing $0.0024490 could expose the lower Bollinger Band near $0.0021459.
Reaching $0.01 by 2030 remains a speculative long-term scenario rather than a certainty. FREYSA would require sustained demand, stronger market participation and successful breaks above several resistance areas to achieve the target.
FAQs
1. Is FREYSA currently bullish?
FREYSA shows moderately bullish momentum because price remains above the middle Bollinger Band while RSI has strengthened above the neutral 50 level.
2. What is the key resistance level for FREYSA?
The nearest resistance stands around $0.0027520 at the upper Bollinger Band, followed by the psychological $0.0030000 region.
3. What are the important FREYSA support levels?
The middle Bollinger Band around $0.0024490 provides immediate support, while the lower Bollinger Band near $0.0021459 represents a deeper technical level.
4. Can FREYSA reach $0.01 by 2030?
FREYSA could potentially reach $0.01 under a sustained long-term bullish scenario, although it would require substantial appreciation from its current price.
5. What could weaken the FREYSA price outlook?
Failure to hold $0.0024490, a breakdown below $0.0021459, declining buying pressure and broader cryptocurrency market weakness could undermine the bullish outlook.
Also Read: Anoma (XAN) Price Prediction 2026–2030: Can XAN Hit $0.10?
The post Freysa (FREYSA) Price Prediction 2026–2030: Can FREYSA Hit $0.01? appeared first on 36Crypto.