Solana led August app revenue while transaction growth and AI payment infrastructure strengthened its broader network activity outlook. SOL faced intraday pressure near $105 as exchange flows
- Solana led August app revenue while transaction growth and AI payment infrastructure strengthened its broader network activity outlook.
- SOL faced intraday pressure near $105 as exchange flows increased, leaving traders focused on support and nearby resistance levels.
- Late-August netflow spikes accompanied SOL's recovery, though exchange transfers alone remain unreliable as short-term price predictors.
Solana price outlook remains balanced between strong ecosystem growth, short-term technical weakness, and increasingly active exchange flows shaping market conditions during early September.
Solana Leads August's Onchain Revenue Race
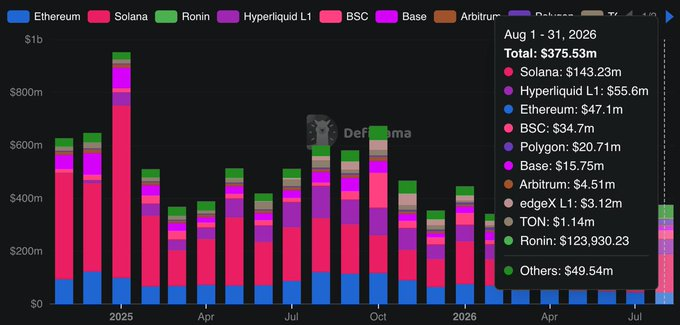
Solana Stream reported $143 million in August application revenue across the network. The figure represented approximately 38% of tracked cross-chain application revenue. Total revenue across the measured ecosystem reached roughly $375.5 million.
Source:
XHyperliquid followed with approximately $55.66 million, while Ethereum generated $47.1 million. BSC recorded roughly $34.7 million during the same period. Solana therefore exceeded the combined application revenue of those three networks.
The August performance followed a comparatively quieter July for Solana's application economy. Revenue reportedly increased from approximately $82.9 million to more than $143 million. Meanwhile, non-vote transactions reached 5.2 billion during the month.
The growth extended beyond a single application category or protocol. Trading, DeFi, consumer applications, token launches, stablecoins, and tokenized assets contributed. Tokenized equity activity also reached new highs during the reported period.
SOL Price Faces Short-Term Technical Pressure
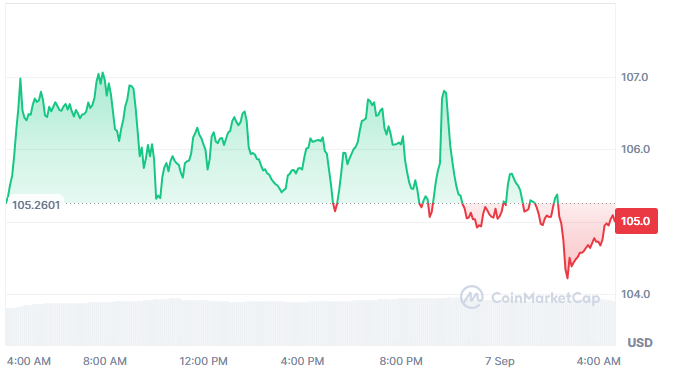
Despite ecosystem growth, SOL's intraday chart showed weaker immediate price momentum. The token's price was around $104.96 and has dropped around 0.92% in the past 24 hours. There was significant market activity with daily trading volume close to $3.62 billion.
Source:
CoinmarketcapPrice initially moved above $106 and repeatedly approached the $107 area. However, sellers emerged during attempts to sustain higher intraday levels. The $105.5 region gradually shifted from an equilibrium area into resistance.
A late-session decline pushed SOL toward approximately $104.2 before buyers responded. The rebound brought prices closer to $104.9, preventing an immediate continuation lower. Still, the recovery remained incomplete without reclaiming the previous $105.5 area.
Near-term chart levels now provide a clearer framework for market participants. Support sits around $104.0-$104.3, based on the recent reaction. Resistance appears near $106, with $106.8-$107 forming a higher ceiling.
Exchange Flows Show Active Capital Rotation
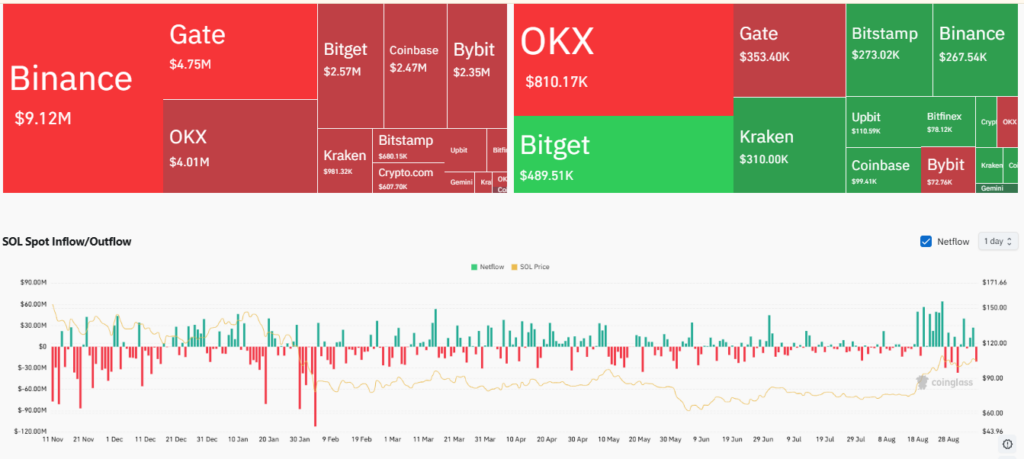
Exchange netflow data added another layer to the developing market picture. Binance showed the largest negative reading at approximately $9.12 million. Gate, OKX, Bitget, Coinbase, and Bybit also recorded notable negative flows.
Source:
CoinglassPositive flows appeared across several exchanges during the same measurement period. OKX led that group near $810,000, followed by Bitget and Gate. Kraken, Bitstamp, and Binance also registered smaller positive readings.
The broader chart showed volatile flows between November and January. SOL subsequently declined from earlier levels near $120 to $150. Price later stabilized around $60 before beginning a gradual recovery.
Late August produced several unusually large positive netflow bars alongside SOL's advance. Prices recovered from roughly $80–$90 toward the $120–$130 region before retreating. Exchange movements therefore showed expanding liquidity activity, while remaining insufficient as standalone price predictors.