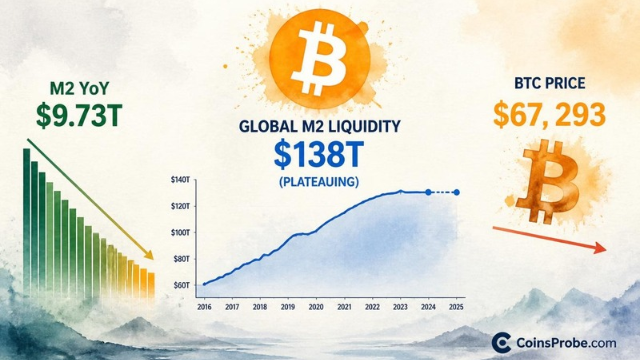
Key Highlights Bitcoin trades at $67,293 (-2.22% 24h) as Global M2 flatlines near $138T — removing the liquidity tailwind behind the cycle rally above $100K Global M2 YoY growth has fallen to
Key Highlights
Bitcoin trades at $67,293 (-2.22% 24h) as Global M2 flatlines near $138T — removing the liquidity tailwind behind the cycle rally above $100K
Global M2 YoY growth has fallen to $9.73T since February 2026 — still positive, but decelerating sharply per Alphractal data
Historical BTC cycle lows (2015, 2018, 2022) coincided with M2 YoY turning negative — current reading is not yet at that threshold
Bitcoin is trading at $67,293 — down 2.22% in the past 24 hours — with a market cap of approximately $1.35 trillion, as a macro liquidity signal that has historically governed BTC’s major cycle tops and bottoms moves into a critical phase. Global M2 Money Supply has stopped rising. After a sustained expansion through 2025 and into early 2026, the world’s broadest measure of money supply is now moving sideways near $138 trillion — and the year-over-year rate of change has been falling since February 2026.
The observation comes from an analyst at Alphractal (@Alphractal), who flagged on November 13, 2026 that the Global M2 YoY figure has contracted to $9.73 trillion — still positive, but decelerating sharply from the expansion peak. The implication is not a crash call. It is a liquidity-headwind warning: BTC has historically tracked M2 with a lag, and when that tailwind fades, the asset’s price action softens accordingly.
The first chart shared by Alphractal plots Bitcoin’s price against Global M2 Money Supply from approximately 2021 through November 2026. The M2 line (blue area) shows a broad trough in 2022–2023, followed by a sustained upward expansion through 2025 and into early 2026, now flattening near its highs. Bitcoin (white line) tracked with a characteristic lag — posting sharp rallies in the wake of M2 expansions, peaking above $100,000, and now declining sharply toward current levels near the right edge of the chart.

Chart 1 of 2: Chart Analysis | Source: @Alphractal (X)
What the chart makes visually explicit is a correlation that quantitative macro analysts have documented across multiple cycles: BTC does not lead M2 — it follows it, typically with a delay of several weeks to a few months. When M2 was expanding, that expansion provided a persistent liquidity floor under risk assets. With M2 now moving sideways near $138 trillion, that floor is not collapsing — but it is no longer rising. For Bitcoin, a stalling M2 is not neutral. It removes the structural tailwind that powered rallies from $16,000 in late 2022 to above $100,000 by late 2025.
The second chart introduces a more sensitive instrument: Global M2 Year-over-Year change, plotted in absolute dollar terms from 2010 through 2026 against Bitcoin’s price on a logarithmic scale. The M2 YoY bars show cyclical green expansions — the expansionary pulses that preceded each of Bitcoin’s major bull runs — and brief red contractions that have historically coincided with BTC’s deepest bear markets.

Source: @Alphractal (X)
The current reading is $9.73 trillion YoY — still in positive territory, but declining since February 2026. This distinction is what makes Alphractal’s analysis precise rather than alarmist. According to the research, BTC has historically bottomed when M2 YoY turned negative — a phenomenon documented in 2015, 2018, and 2022. Each of those instances marked the depth of a bear market, not a continuation phase. The current reading at $9.73 trillion does not meet that threshold. YoY is still positive. The analyst’s conclusion is explicit: this is not yet a bottom signal. It is a signal that liquidity momentum is losing force.
The practical translation: in prior cycles, the transition from decelerating-but-positive M2 YoY to negative YoY took months — and BTC moved substantially lower during that transition before the eventual bottom was registered. The question the data raises is whether the current deceleration resolves by stabilizing and re-accelerating, or by continuing lower toward zero and eventually into contraction territory.
The M2 framework is a macro lens, not a trading signal. Several important limitations apply. First, the lag between M2 movements and BTC price responses is variable — it has ranged from weeks to several months across documented instances. Second, Global M2 aggregates supply across multiple currencies and central banks; regional divergences (a Fed pivot, a PBOC stimulus package, ECB balance sheet expansion) can alter the aggregate direction faster than the current trend implies. Third, M2 YoY at $9.73 trillion remains well above the zero line — the level at which prior cycle lows were established.
What the data does confirm with precision: the liquidity expansion that powered Bitcoin’s rally from the 2022 lows to above $100,000 was structurally supported by M2 growth. That growth has now plateaued. For context, BTC and ETH whale activity has been showing distribution signals in recent weeks — a pattern tracked in detail here. Separately, stablecoin supply has been contracting, with USDT supply shrinking $6.6 billion in 60 days — another on-chain signal consistent with tightening liquidity conditions.
Alphractal does not publish a price target in this analysis, and the article does not manufacture one. What the framework does establish is a clear condition for escalating concern: if Global M2 YoY continues declining from $9.73 trillion toward zero, BTC has historically entered its most damaging drawdown phases during that transition. If, by contrast, global central banks — particularly the Federal Reserve, People’s Bank of China, and European Central Bank — resume balance sheet expansion and reverse the M2 YoY decline, the structural tailwind returns.
At $67,293, Bitcoin is trading below the $100,000 level printed on Alphractal’s chart and roughly 54% below the cycle peak above $146,000 visible on the right axis. The M2 signal does not say that level is a bottom. It says the macro liquidity conditions that produced the rally to those highs are no longer present in the same form. That is a materially different market environment — and it is what the data currently shows.
Watch the Global M2 YoY figure as it updates monthly: a move below $5 trillion would represent meaningful further deceleration, and a cross below zero would match the conditions that have historically confirmed Bitcoin cycle lows.
Disclaimer: The views and analysis presented in this article are for informational purposes only and reflect the author’s perspective, not financial advice. Technical patterns and indicators discussed are subject to market volatility and may or may not yield the anticipated results. Investors are advised to exercise caution, conduct independent research, and make decisions aligned with their individual risk tolerance.
Also Read: Bitcoin Midterm Cycle Pattern Repeats — 2014, 2018, 2022, and Now 2026