Will buyers defend the $1.152 support level this month, or is a slide toward the $0.997 level next? The Gram price prediction November 2026 setup opens with a weak tape. Gram, formerly Toncoi
Will buyers defend the $1.152 support level this month, or is a slide toward the $0.997 level next?
The Gram price prediction November 2026 setup opens with a weak tape. Gram, formerly Toncoin, trades at $1.19 perCoinGecko market data, captured Nov 4, 2026, 10:30 UTC. Sellers hold the daily chart. But buyers are pressing the upper trendline.
Market Snapshot Behind the Gram Price Forecast
CoinGecko market data, captured Nov 4, 2026, 10:30 UTC, sets the base for every price in this article.
Metric
Value
Price
$1.19
24-hour change
2.94%
Market cap
$3.392B
FDV
$6.28B
24h trading volume
$33.275M
Perps open interest
$146.132M
Circulating supply
2.851B GRAM
Total supply
5.278B GRAM
Total treasury holding
232,588,021 GRAM
Source: CoinGecko, GRAM market snapshot, Nov 4, 2026, 10:30 UTC
Fully diluted valuation is the value if every token in total supply traded at today's price. For GRAM, FDV reaches $6.28B against a $3.392B market cap.
Only 54.0% of total supply circulates, so the other 2.427B GRAM can still add sell pressure.
CoinGlass price performance data, captured Nov 4, 2026, 10:30 UTC, shows GRAM up 2.94% over 24h and 1.02% over 4h. The 24h range runs from $1.14 to $1.19.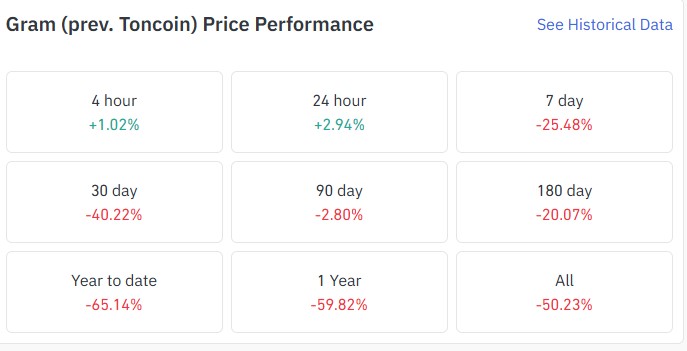
Source: CoinGlass, GRAM price performance, Nov 4, 2026, 10:30 UTC
But the bounce sits inside a heavy slide. GRAM is down 25.48% over 7 days and 40.22% over 30 days.
Year-to-date, -65.14%. A 2.94% gain recovers little of that loss, so the trend still points down. Weak rebounds put the support levels back in play.
Futures Volume and Open Interest: Who Drives GRAM Now
Open interest is the total value of futures contracts still open. CoinGecko lists perps open interest at $146.132M, captured Nov 4, 2026, 10:30 UTC.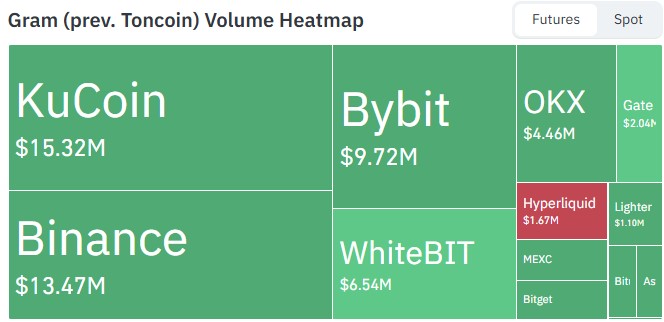
Source: CoinGlass, GRAM futures volume heatmap, Nov 4, 2026, 10:30 UTC
TheCoinGlass derivatives data heatmap puts KuCoin at $15.32M and Binance at $13.47M. Bybit follows at $9.72M, then WhiteBIT at $6.54M.
The top three venues hold 70.9% of the $54.32M posted across eight venues.
Period Catalysts and Risks for the November Outlook
Buyers need a daily candle trading above the channel's upper trendline, then a reclaim of $1.314. For wider context, see thelatest crypto market news.
Gram Technical Analysis: 50-Day EMA and RSI Levels
Source: TradingView, GRAM/USDT 1D, Nov 4, 2026, 10:30 UTC
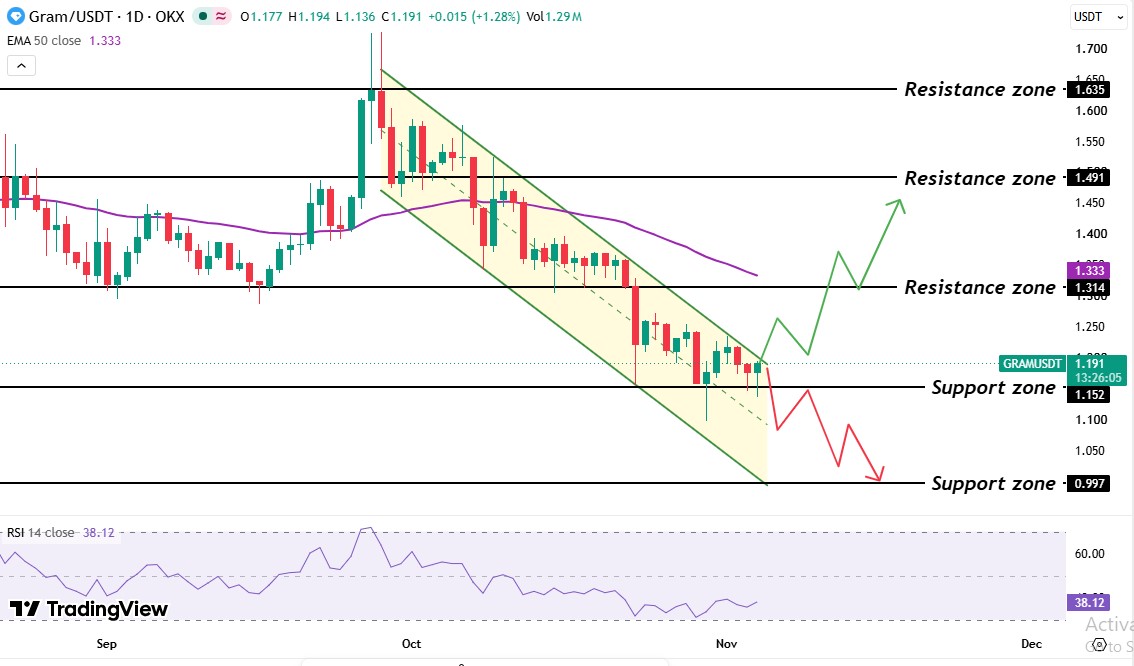
The OKX 1D chart for GRAM/USDT on TradingView, captured Nov 4, 2026, 10:30 UTC, frames this Gram price prediction November 2026.
A sharp late-September rally spiked near $1.70 before sellers took control. Price then slid inside a descending channel, two falling parallel trendlines that hold a price between a ceiling and a floor. Sellers defended the trendline on every try to break it.
Right now, GRAM trades above the $1.152 support zone, where buyers have stepped in, and below the $1.314 resistance zone. The 50-day EMA sits at $1.333, and GRAM's $1.19 price trades 10.73% below it.
A real recovery needs a trendline break and an 50 EMA reclaim. For the prior setup, see theOctober Gram price prediction.
The GRAM RSI reads 38.12 on the 14-day setting. Under 50, sellers hold the momentum edge. Above 30, oversold conditions haven't formed, so price has room to fall.
Gram Support and Resistance Levels
Level
Role
$0.997
Support
$1.152
Support
$1.314
Resistance
$1.491
Resistance
$1.635
Resistance
Gram Price Prediction: Bull, Base, and Bear Scenarios
Scenario
Trigger
Target
Invalidation
Bull
Daily candle above $1.314
$1.491, then $1.635
Daily candle below $1.152
Base
Price holds between $1.152 and $1.314
Range
Daily candle outside range
Bear
Daily candle below $1.152
$0.997
Daily candle above $1.314
The bull case needs two steps, a channel break and a reclaim of the 50-day EMA. The bear case needs one.
Risk factors are plain. A technical break of the $1.152 support level opens the drop, and the remaining 2.427B GRAM adds supply. And crowded leverage can turn a dip into a flush.
Gram Price Prediction November 2026: Expert Outlook
As per CoinGabbar analysis, the Gram price prediction November 2026 leans bearish. The 50-day EMA at $1.333 caps rallies, and the RSI at 38.12 gives sellers the momentum edge.
Sellers defended the channel's upper trendline on every earlier push, and buyers haven't posted a daily candle above it yet. The base case is a choppy range between $1.152 and $1.314.
A daily candle trading above the upper trendline, backed by volume over the current $33.275M, would be the first sign that buyers retook control. Until then, a daily candle trading below $1.152 confirms the channel and puts $0.997 in play.
YMYL Disclaimer: This article is for informational and educational purposes only and should not be taken as financial or investment advice. Crypto markets are volatile.