XRP price is trading near $1.10 with little to no movement during the weekend. The token has been range-bound for weeks, struggling to break above $1.17 while defending $1.08 support. But one
XRP price is trading near $1.10 with little to no movement during the weekend. The token has been range-bound for weeks, struggling to break above $1.17 while defending $1.08 support.
But one of my favorite analysts, Celal Kucuker, decided to update his XRP price prediction last night. This time he was very direct. He gave XRP price targets when Bitcoin hits $120,000 and Ethereum hits $6,000.
Celal Kucuker: “$6 XRP When BTC Hits $120K”
Celal Kucuker posted a clear and direct XRP price outlook. His message was simple:
“If BTC hits $120K and ETH hits $6K, XRP WILL hit $6. In a MEGA bull run, XRP will push $11–$15. No ‘maybe.’ No ‘if.’ XRP is the altcoin I trust the most.”
This is one of the most confident XRP predictions I have seen. Kucuker is not hedging. He is not saying “could” or “might.” He is stating it as a fact. In crypto, nothing is a fact for sure, but I like the optimism.
The logic is straightforward. If Bitcoin reaches $120,000 and Ethereum reaches $6,000, the entire crypto market will be in a mega bull run. In that environment, XRP will benefit from the same capital inflows that drive BTC and ETH higher.
But Kucuker’s confidence in XRP specifically is notable. He trusts XRP more than any other altcoin. That is a strong statement from an analyst who has been covering the market for years.
The XRP Chart: A Multi-Year Bullish Structure
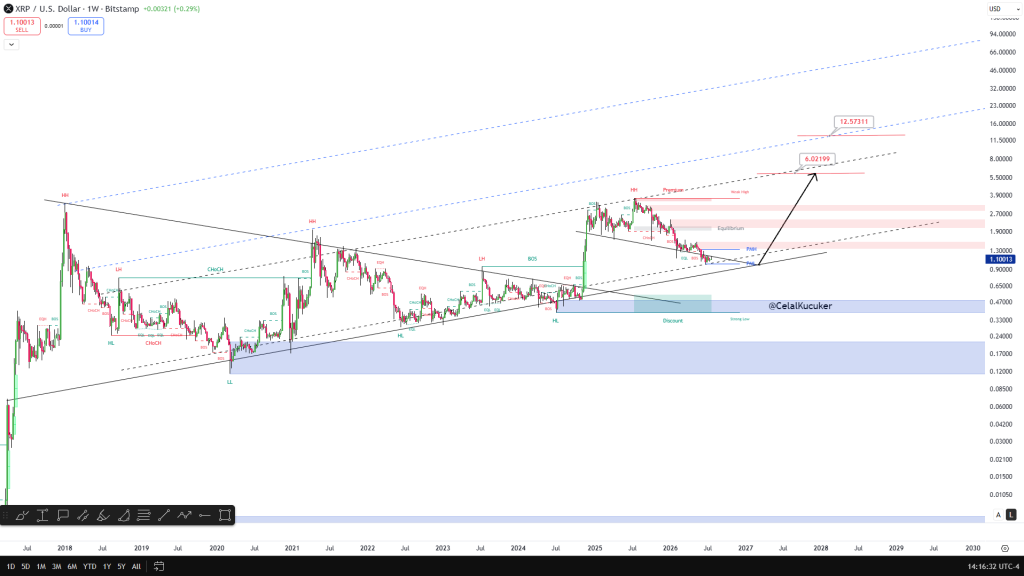
The chart Kucuker shared is a weekly timeframe from 2018 through 2026, with log-ish trend channels and Smart Money Concepts (SMC) annotations.
Overall structure (2018–2026):
XRP topped near $3.90 in January 2018, then spent 2018–2020 in a long descending structure, bottoming near $0.11–$0.17 in March 2020. That whole zone is marked as a multi-year support and demand block.
From 2020–2021, price rallied hard into a new high around $1.80–$1.96 , then rolled over into another multi-year descending triangle from 2021–2024. That triangle broke out in late 2024, with a sharp impulsive rally into a new high near $3.30–$3.40 , followed by the current pullback and consolidation structure.
Current zone (2025–2026):
The XRP price rallied to a “Premium” zone above $3, tagged a weak high, then pulled back through equilibrium into a marked “Discount” and support zone around $1.00–$1.30 , with a “Strong Low” label near the recent swing low (~$1.10). The blue “PMH” (previous major high) and EQL/BOS labels around $1.10–$1.30 indicates the chart author sees this as a demand zone and potential higher-low.
 Source: X/@CelalKucuker
The forward-looking part:
The diagonal arrow and the $6.02 and $12.57 labels are the chart author’s own projected targets. They are essentially a manual measured-move and Fibonacci-extension-style projection, assuming the current pullback holds as a higher low and price resumes the broader uptrend.
$6.02 lines up roughly with an extension of the long-term ascending channel. $12.57 sits near the upper channel boundary.
How to read this critically:
This is discretionary Smart Money Concepts annotation – HH/HL/LH/LL, BOS, CHoCH, premium/discount, equilibrium – which is a popular but subjective framework. Different analysts would mark swing points differently.
The $6+ and $12+ targets are aspirational projections contingent on the “Strong Low” around $1.10–$1.30 holding. If that support breaks, the bullish structure invalidates and the descending-triangle pattern from 2021–2024 could reassert.
Long-term channel lines drawn from 2018 highs and lows are visually persuasive but not a reliable predictive tool on their own. They are drawn after the fact and can be redrawn to fit almost any move.
Bottom line: The chart depicts the XRP price holding support in a “discount” zone after a 2024 breakout, with a bullish setup if the current low holds, projecting toward $6–$12.5 over a multi-year horizon. That is a specific, fairly optimistic scenario built on subjective trendline and channel work, not a guaranteed outcome.
Clarity Act Update: The Legislative Timeline
Journalist Vincent Scott tweeted an important update on the Clarity Act timeline:
“The U.S. House of Representatives is out of legislative session till Aug 30th. Meaning: Even if Senate passes Clarity this week, it has to go back to the House to be voted on again, September 1st (since there were changes and amendments made).”
If the House does not add changes, it goes to the President to sign. If they do add changes, it goes back to the Senate and then to the President.
Once signed, there is an up to 180-day window for regulatory agencies to commence, plus a 120-day waiting period before it is effective.
Unless an event compels Congress to pass a simple majority bill to make both GENIUS and Clarity effective immediately.
What this means: The Clarity Act is not passing this week. Even if the Senate votes, the House is out of session until August 30. The earliest possible effective date is months away. The market may have to wait until early 2027 for the bill to actually take effect.
Read also: Pro-XRP Lawyer Slams Elizabeth Warren for Opposing the CLARITY Act
Where Could XRP Price Go From Here?
Kucuker’s $6–$12.5 targets are long-term XRP price projections. They assume that the current support holds and that Bitcoin and Ethereum reach their targets. But the short-term picture is different.
Short-term (next few weeks): XRP is stuck in a range between $1.08 and $1.17. The Clarity Act timeline is extended. There is no immediate catalyst. Expect continued consolidation between $1.05 and $1.20.
Medium-term (next 3-6 months): If Bitcoin continues its recovery toward $70,000–$80,000, XRP could follow. The first major target is $1.50 . A break above $1.50 would open the door to $2.00 . But this requires a broader crypto market recovery and positive news around the Clarity Act.
Long-term (next 1-2 years): If Kucuker’s scenario plays out – Bitcoin to $120,000, Ethereum to $6,000, and the Clarity Act providing regulatory clarity – XRP could reach $6–$12.5 . The $6 target is plausible in a strong bull cycle. The $12.5 target is ambitious but mathematically possible.
The key level to watch: $1.10–$1.30 is the “Strong Low” zone that Kucuker identified. If this support holds, the bullish structure remains intact. If it breaks, the entire bullish scenario could be invalidated.
For now, I am watching the $1.10 support and the $1.20 resistance. A pump above $1.20 would be the first bullish signal. A pump below $1.08 would be bearish.
Subscribe to our YouTube channel for daily crypto updates, market insights, and expert analysis.
The post Here’s the XRP Price When Bitcoin Hits $120K and Ethereum Hits $6K appeared first on CaptainAltcoin.