Gold price has already delivered one of its strongest multi year runs, but something interesting is now happening away from the metal itself. Gold mining stocks are participating much more br
Gold price has already delivered one of its strongest multi year runs, but something interesting is now happening away from the metal itself. Gold mining stocks are participating much more broadly, and the speed of that improvement resembles a setup that previously came before a major GDX rally.
The Kobeissi Letter pointed to this change in a Facebook post. Its data showed that a much larger portion of gold mining stocks has moved above an important long term technical level within only a few weeks.
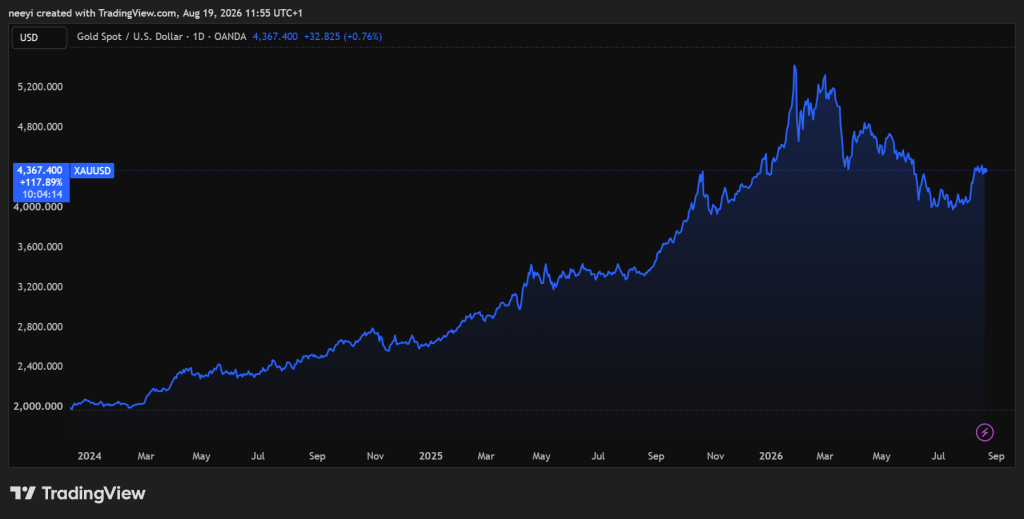
That does not guarantee another major move for GDX or gold price. Still, the historical comparison makes the latest change worth examining, especially after gold moved from around $2,000 in 2024 to a record above $5,500 in early 2026.
Gold Miners Record a Big Change in Market Breadth
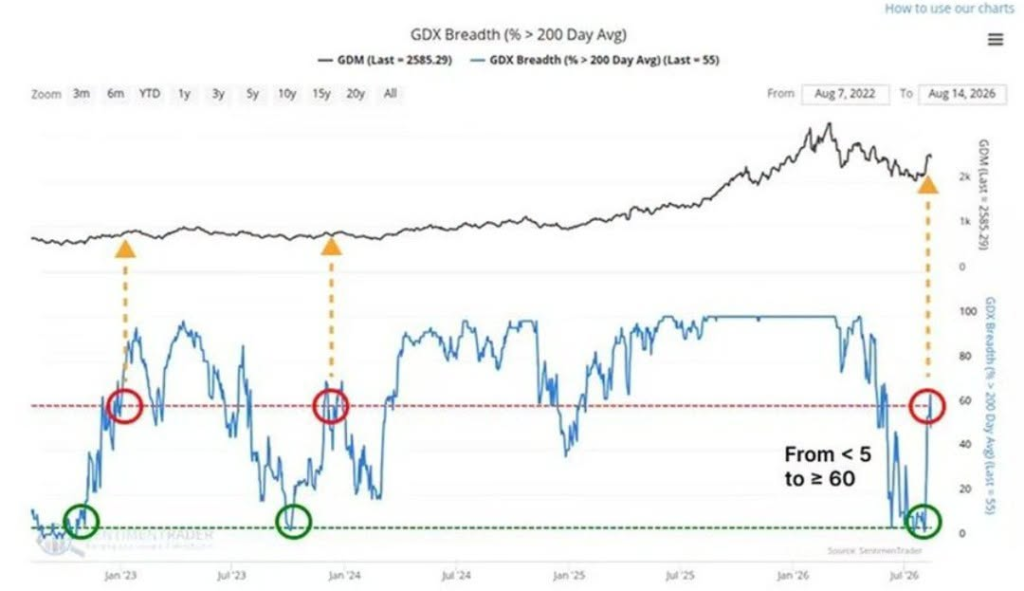
The Kobeissi Letter wrote on Facebook that breadth across gold miners has improved rapidly.
Roughly 62% of stocks inside the VanEck Gold Miners ETF, or GDX, are now trading above their 200 day moving averages. That is the highest proportion recorded since May.
The change happened very quickly as well. The percentage increased by 57 percentage points within only 3 weeks. GDX gained 22% during the same period and moved into bull market territory.
The Kobeissi Letter also noted that this was the fastest improvement in gold miners’ breadth since March and April 2024.
Market breadth simply helps show how many individual stocks are participating in a market move. A GDX rally led by only a few large mining companies would look very different from one where most miners are moving in the same general direction.
 The Kobeissi Letter
 / Facebook
The current numbers point toward broader participation. Roughly 62% of GDX components trading above their 200 day moving averages means strength has spread across a much larger part of the sector.
That distinction becomes important when considering what happened the previous time gold miners produced a comparable breadth expansion.
Why the GDX Rally Matters for Gold Price
GDX does not mechanically control gold price. Gold mining stocks are equities, and physical gold operates in a different market.
Their relationship still matters because mining companies derive much of their economic value from the price of the metal they produce. Higher gold prices can improve mining profitability when production costs remain relatively stable.
Consider a simple example. A mining company might spend $1,500 to produce an ounce of gold and sell that ounce for $2,000. The difference would leave a $500 operating margin before other expenses.
Gold price moving 25% higher to $2,500 would change that calculation considerably. Production costs could remain around $1,500, which would increase the margin to $1,000.
That is why miners can sometimes move much faster than gold itself during strong precious metals cycles.
GDX can also provide clues about participation within the broader gold market. Mining equities offer investors another liquid way to gain exposure to movements in gold price, and stronger demand across many mining companies can indicate greater confidence in the sector.
The GDX to GLD relationship also helps explain why investors watch miners closely. GDX represents gold mining equities, whereas GLD provides exposure much closer to the price of gold itself.
Periods when GDX performs better than gold can show stronger appetite for the equity side of the precious metals market. That does not automatically mean gold price must follow, but miners performing strongly can strengthen the broader case for continued interest in gold.
Corporate activity can become more active during strong mining cycles as well. Higher valuations and stronger cash positions can give mining companies more room for exploration, mergers, acquisitions, and other investments.
Those developments can keep the wider gold sector active even after the first phase of a rally has already passed.
The Last Time Gold Miners Saw This Setup, GDX Rallied 52%
The historical comparison is where the current breadth data becomes especially interesting.
The Kobeissi Letter noted that gold miners produced a similar breadth expansion during March and April 2024. GDX then gained 52% during the following 12 months.
The comparison centres on the percentage of miners trading above their 200 day moving averages.
Current data shows that 62% of GDX components have moved above that level. The percentage climbed by 57 points within 3 weeks, and GDX gained 22% during the same period.
Read Also: Why Avalanche (AVAX) Price Can Reach a Top 10 Crypto Again: Analyst
The 2024 setup also involved a rapid expansion in the number of mining stocks trading above their longer term averages. GDX eventually moved 52% higher over the next year.
That does not mean another 52% move must follow. Historical setups can repeat in appearance without producing identical results.
The comparison still matters because breadth can help separate a narrow rally from a move supported across much of the sector. Small, medium, and large miners participating together can make the underlying move look healthier than one driven mostly by a few large companies.
Gold price also provides important context because the metal has already moved dramatically since that earlier 2024 setup.
Gold Price Prediction: Where Gold Could Go From Here
Gold’s journey since 2024 helps explain why the current GDX setup deserves attention.
Gold gained roughly 26% during 2024 and recorded more than 40 all time highs. The metal finished the year above $2,600 per ounce. Central bank reserve purchases and geopolitical risks were major drivers during that period.
Gold Price Chart / TradingView.com
The rally continued into 2025. Gold price crossed $3,000 early in the year and later reached roughly $3,900 to $4,000 per ounce during the final months.
Asian retail demand and safe haven allocation remained important parts of the gold price story during that period.
Gold then produced another major move during January 2026. The metal reached an intra year record above $5,500 per ounce before pulling back later.
Prices eventually moved into a range between roughly $4,000 and $4,400 during the middle part of 2026. Federal Reserve rate expectations and geopolitical risks across the Middle East remain important forces behind current market activity.
That leaves gold price at an interesting point.
A continuation of the GDX breadth expansion could support the case that the precious metals cycle still has strength beyond the metal’s January peak. Gold would first need to prove that the current $4,000 to $4,400 area can provide a stable base.
Renewed strength from that zone could reopen discussion around the previous record above $5,500. A return toward that level would represent the clearest major test for gold price.
A successful move beyond the previous peak could then open the door to price discovery. The current information does not provide enough evidence for a reliable target beyond that level, so assigning an exact figure would go beyond what the present setup can support.
What Could Invalidate the Bullish Gold Setup?
The current GDX breadth data looks constructive, but several developments could weaken the comparison with 2024.
A major reversal across gold miners would be the clearest warning. The current case depends heavily on broad participation, so a rapid drop in the percentage of GDX stocks above their 200 day moving averages would weaken that argument.
GDX itself also matters. The ETF has already gained 22% during the recent breadth expansion. Failure to retain much of that move could indicate that the improvement was temporary.
Read Also: Kaspa (KAS) vs. Zcash (ZEC): AI Chooses the Potential Long Term Winner
Gold price provides another important test. A prolonged break below the current $4,000 to $4,400 range would make the bullish comparison harder to defend because miners ultimately depend heavily on the economics of the underlying metal.
Broader equity market weakness could create another problem. Gold miners remain publicly traded companies, so severe stock market stress could pressure GDX even if demand for physical gold remains firm.
The current setup therefore offers an interesting historical comparison rather than a guarantee. Gold miners are participating much more broadly, GDX has already advanced 22%, and the previous comparable breadth expansion came before a 52% GDX rally.
FAQs
Is XAU actual gold?Yes, XAU represents actual physical gold. It is the official ISO 4217 currency code for one troy ounce of gold, where “X” means a precious metal/commodity and “AU” comes from aurum, the Latin word for gold.
Is XAU a good investment?XAU (gold) is widely considered a good tool for portfolio diversification and a safe-haven asset during high inflation or geopolitical tension, trading at approximately $4,400 per ounce. However, whether it is a “good investment” depends entirely on your financial goals, as it pays no dividends and experiences short-term price volatility
Subscribe to our YouTube channel for daily crypto updates, market insights, and expert analysis.
The post Here’s Where Gold Price Could Go as Breadth Across Gold Miners Improves appeared first on CaptainAltcoin.