The HBAR price is trading at $0.0695, up 1.38% over the past 24 hours, giving bulls a small recovery after weeks of range-bound trading. In our last Hedera weekly prediction, we said HBAR nee
The HBAR price is trading at $0.0695, up 1.38% over the past 24 hours, giving bulls a small recovery after weeks of range-bound trading.
In our last Hedera weekly prediction, we said HBAR needed to break $0.075 to open the way toward $0.085 and $0.09–$0.10, or lose $0.065 to risk a move toward $0.060 and $0.05.
That breakout never came. Instead, HBAR remained inside the range, with the latest bounce lifting it back toward $0.070. The question now is whether the ETF, tokenized-asset activity, and enterprise developments can provide enough demand for HBAR to finally escape this range.
Catalysts Driving the HBAR Price This New Week
Institutional exposure to HBAR is growing through Canary’s Nasdaq-listed spot ETF, which now holds about $47.8 million in assets. Separate data puts cumulative HBAR ETF inflows near $105 million, giving the token a real institutional demand channel, although it remains smaller than the ETF markets for XRP and Solana.
Hedera is also gaining practical use in tokenized finance. Archax launched real-time USDC interest payments on Hedera on August 5, allowing holders of tokenized assets to receive interest continuously instead of through traditional periodic distributions.
The network also received a mention in the FATF’s July 2026 DeFi report, alongside Ethereum and Solana, as an example of a distributed-ledger settlement layer. That does not represent regulatory approval, but the reference adds institutional relevance to Hedera’s focus on compliant financial infrastructure.
What Is the Hedera HBAR Chart Showing?
We opened up the chart, and the first thing that jumps out is the big box HBAR’s been trapped in, $0.065 on the bottom, $0.075 on top.
All through July, the Hedera price kept falling to $0.065 and bouncing up. But every time it tried to climb toward $0.071 or $0.074, sellers came in and pushed it right back down. Right now, HBAR is floating around $0.0694 to $0.0695, smack in the middle of that range.
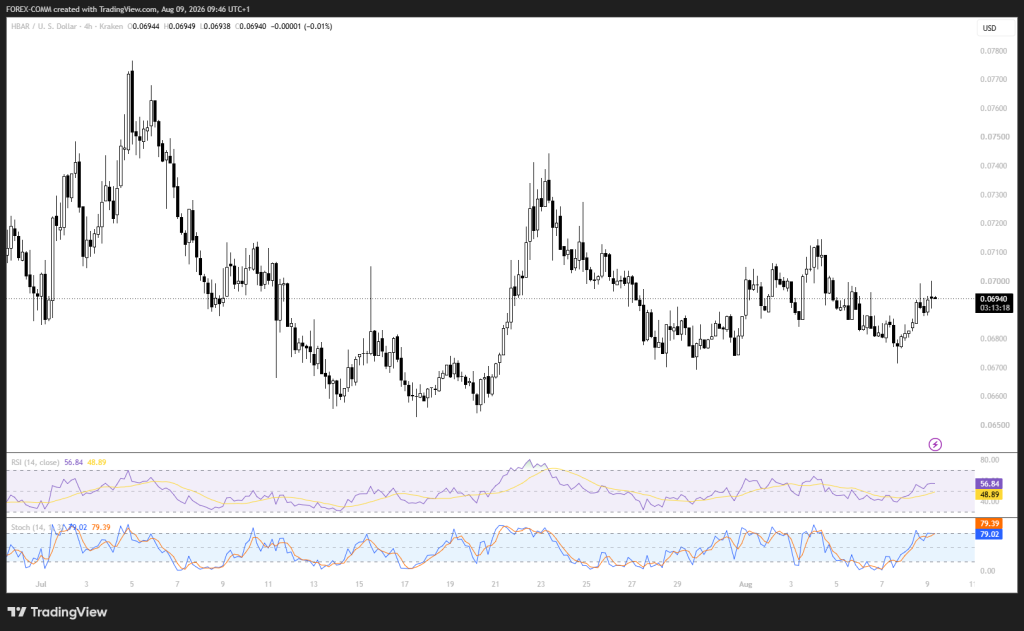 Source: Tradingview.com
Looking at the latest candles, buyers have been defending $0.068 pretty well. The most recent bounce pushed the Hedera price back toward $0.070. If it breaks above $0.071, bulls can take a shot at $0.075, that’s the big ceiling we talked about last week. A daily close above $0.075 would be the clearest sign that buyers are in control.
Momentum is looking better too. The RSI is 56.84, above 50, so buyers have a slight edge without being overextended. The Stochastic is near 79, with readings of 79.02 and 79.39, that shows strong short-term energy, but it’s also getting close to the 80 overbought zone, so it might cool off soon.
Related Hedera News: HBAR News: Mastercard Adds Hedera to Crypto Program as Network Tops 70 Billion Transactions
Where Will the Hedera Price Go This Week?
If HBAR closes a daily candle above $0.075, it could run to $0.085. And if more buyers jump in with heavier volume, $0.09 to $0.10 could be next.
More than likely, though, the HBAR price stays stuck between $0.065 and $0.075. The $0.070 area will probably be the main fight zone, with traders watching ETF money flows and what Hedera’s doing with tokenization.
But if HBAR closes below $0.065, that range falls apart. Then $0.060 comes into view. Lose that too, and the price could drop all the way to $0.050
Frequently Asked Questions
What is the HBAR price prediction for this week
The HBAR price could remain between $0.065 and $0.075 in the base case. A daily close above $0.075 could open the way toward $0.085, followed by $0.09–$0.10.
What is Hedera’s spot ETFCanary’s Nasdaq-listed Hedera spot ETF gives investors regulated exposure to HBAR and holds about $47.8 million in assets. Cumulative HBAR ETF inflows are also near $105 million, making ETF demand an important factor for the token.
How is Hedera being used for tokenized assetsArchax launched real-time USDC interest payments on Hedera, allowing holders of tokenized assets to receive interest continuously. The development adds a practical use case for Hedera’s RWA infrastructure and could support demand for the network over time.
Subscribe to our YouTube channel for daily crypto updates, market insights, and expert analysis.
The post Here’s Where Hedera (HBAR) Price Could Go This Week? appeared first on CaptainAltcoin.