Kaspa is testing $0.026, a decisive level. Drop below that, and the bears win. Hold it, and maybe buyers will finally show up. The KAS price fell 2.7% over the last day to $0.026053. The broa
Kaspa is testing $0.026, a decisive level. Drop below that, and the bears win. Hold it, and maybe buyers will finally show up.
The KAS price fell 2.7% over the last day to $0.026053. The broader crypto market only dipped a little, but Kaspa got hit harder. It broke through some key levels on the chart, and the indicators look rough. RSI is deep in oversold territory. Price is barely above its recent low of $0.026034.
Bitcoin only dropped 0.8%, so that’s not the main culprit. The real problem? Social media is negative on Kaspa right now. That’s weighing on sentiment.
But here’s the twist: on-chain data tells a different story. Long-term holders aren’t selling. They’re hanging on. That means this drop might not be as bad as it looks.
What’s Really Driving the Kaspa Sell-Off
The Kaspa price is hanging by a thread at $0.026053, barely above its recent low of $0.026034. The indicators are ugly. RSI is down to 26.57, deep in oversold territory. MACD is still negative. Sellers are in full control.
But here’s the thing: this looks more like traders bailing than anything fundamentally wrong with Kaspa. The Bitcoin price only dropped 0.8%, but Kaspa got clobbered harder. That tells you it’s specific selling pressure, not a market-wide panic. Social media is split, bears are pointing at the downtrend and lighter retail interest.
There is something big coming though. On August 5, Kaspa’s block reward gets cut. New Kaspa (KAS) entering the market will drop. If demand holds up, that could help prices. But first, buyers need to push past resistance at $0.02983. For now, the key support zone is $0.02654 to $0.02600. That’s the line in the sand.
Kaspa’s On-Chain Data Paints a Different Picture
Despite the weakness in the Kaspa price, on-chain data presents a more encouraging picture.
Kaspa Daily noted that the selling pressure is concentrated among holders who purchased KAS within the last three months. Meanwhile, the people who’ve held Kaspa for a while aren’t flinching.
Get this: over 66% of all KAS in circulation hasn’t moved in more than six months. That’s a new record. Most holders are just sitting on their bags, even as the price slides toward support. They’re not selling.
This type of holder behavior often indicates that newer market participants are driving short-term volatility, whereas long-term investors still expect higher valuations over time. It does not guarantee an immediate recovery, but it reduces the probability that the decline is being driven by widespread panic across the entire holder base.
Kaspa’s Native Chart Analysis
We had a look at the chart, and the price continues to grind lower after failing to reclaim the weekly PD array around $0.02666. The rejection from that level has kept sellers in control, pushing the Kaspa price back toward the critical $0.026 support area.
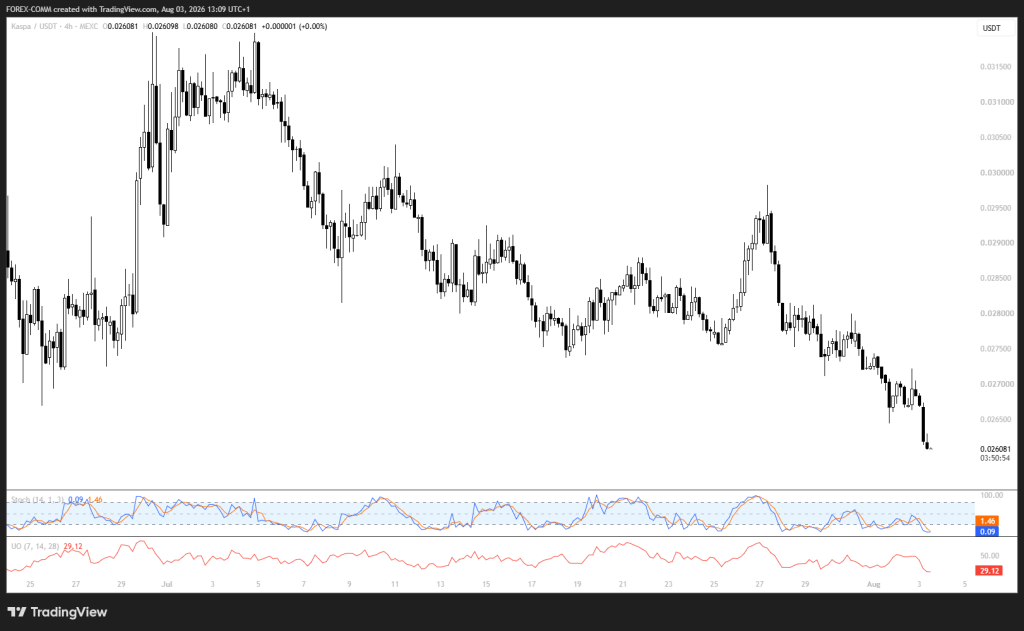 Source: Tradingview.com
Momentum indicators remain weak. The Stochastic is down around 1.46, basically maxed out on the oversold side. The Ultimate Oscillator is at 29.12. Both are screaming that sellers are worn out.
But the KAS price hasn’t shown any real sign of life yet. No strong green candle. No higher low. Nothing that tells you buyers are actually stepping back.
The next technical level below the market is near the monthly PD array around $0.0251. Holding that zone would be important to prevent the broader downtrend from extending.
Related Kaspa News: Kaspa Price Flashes a Rare Reversal Signal as KAS Suddenly Breaks From Bitcoin
Kaspa Price Prediction: What’s Next?
The Kaspa price remains under pressure until buyers reclaim the weekly PD array at $0.02666.
If sellers continue to dominate, price could decline toward the monthly support around $0.0251. That area may provide the first meaningful opportunity for demand to return, especially when combined with the strong long-term holder data showing 66% of supply has remained inactive for more than six months.
If that $0.026 support holds and buyers show up after the August 5 block reward cut, the Kaspa price could eventually run back toward $0.041027.
But until we see real proof, strong volume, a solid bounce, treat any upside as just a bounce inside a downtrend. Don’t call it a reversal yet.
Frequently Asked Questions
Why is the Kaspa price falling today
Kaspa is under pressure due to a technical breakdown below key support levels, oversold momentum, and weaker performance than Bitcoin. The decline is also being driven by short-term holders taking profits or cutting losses, even as long-term investors continue to hold their KAS.
Is the Kaspa price close to a bottomKaspa is testing the important $0.026 support zone, and on-chain data shows that more than 66% of the circulating supply has not moved in over six months. Although this points to strong long-term conviction, price still needs to hold support and attract buyers before a bottom can be confirmed.
What is the next price target for KaspaIf the Kaspa price fails to hold above the weekly support area, it could decline toward the monthly support near $0.0251. If buyers defend that level and momentum improves, the next major upside target is around $0.0410.
Subscribe to our YouTube channel for daily crypto updates, market insights, and expert analysis.
The post Here’s Why Kaspa’s Price Weakness Might Not Be as Bad as It Looks appeared first on CaptainAltcoin.