Bitcoin holds above $77,500, up 1.2% on the day. Ethereum trades near $2,460, up 2.10%. XRP sits below $1.50, up a slim 0.17%. Traders are holding their breath. This week brings a heavy load
Bitcoin holds above $77,500, up 1.2% on the day. Ethereum trades near $2,460, up 2.10%. XRP sits below $1.50, up a slim 0.17%.
Traders are holding their breath. This week brings a heavy load of U.S. economic data, and it could decide where crypto prices head next.
The centerpiece is Fed Chair Kevin Warsh's first Jackson Hole address. Markets want to know if rates are coming down or staying put.
What economic data is coming this week?
The big one lands Wednesday. The Personal Consumption Expenditures (PCE) price index for July is the Fed's favorite inflation gauge.
Economists expect headline PCE to rise 0.1% month-on-month. The annual rate is projected to cool slightly to 3.6% from 3.7%.
Core PCE, which strips out food and energy, is forecast to rise 0.2% for the month. The yearly figure is expected at 3.3%.
Both readings remain well above the Fed's 2% target. A hot print could push rate-cut hopes further out. A soft one could do the opposite.
GDP growth numbers also drop Wednesday. Analysts expect a 1.5% annualized pace for the second quarter, down from 2.1% in Q1.
Thursday brings weekly jobless claims. Forecasts point to 206,000 new claims, unchanged from the prior week.
Then comes Friday. Kevin Warsh delivers his first Jackson Hole speech as Fed Chair at 10 a.m. ET, with this year's theme centered on financial innovation and payments policy.
Date
Event
Forecast
Wednesday
PCE Inflation (July, YoY)
3.6%
Wednesday
Core PCE (July, YoY)
3.3%
Wednesday
GDP Growth (Q2, annualized)
1.5%
Thursday
Jobless Claims (week ending Aug 22)
206,000
Friday
Fed Chair Warsh Jackson Hole speech
10 a.m. ET
Lower rates tend to push investors toward riskier assets like crypto. Higher rates usually do the opposite, since safe government debt starts paying more for less risk.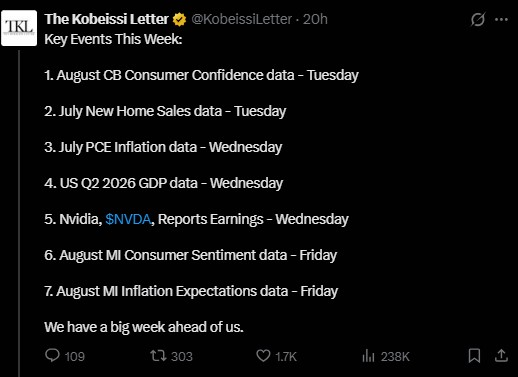
Bitcoin price prediction today
Bitcoin trades around $76,937, up about 0.9% on the day. The coin touched close to $80,000 last week before slipping into a tighter range.
That move capped a sharp 22% rally over eight days, taking BTC from roughly $63,000 to its recent peak.
Futures volume over 24 hours sits near $58.79 billion. Spot volume is much smaller at $4.57 billion. Open interest holds around $55.33 billion.
The long/short ratio sits close to even at 1.0052. Neither bulls nor bears have a strong grip right now.
Why did Bitcoin rally so fast?
The rally followed the U.S. Treasury's move to expand liquidity-support buybacks for longer-dated government debt. Starting September 9, the maximum operation size rises from $2 billion to at least $4 billion.
This is a debt-management step, not quantitative easing. Still, it helped nudge long-term yields lower and lifted demand for riskier assets.
Spot Bitcoin ETFs also saw strong inflows, with roughly $517 million on August 19 and another $606 million the next day.
Short sellers got caught off guard too. As Bitcoin broke higher, forced liquidations of bearish bets added more fuel to the climb.
What are Bitcoin's key support and resistance levels?
Bitcoin trades inside a descending channel on the hourly chart, near $77,020.
Level Type
Price Zone
Resistance
$78,000 – $78,500
Bollinger Upper Band
~$77,840
Bollinger Middle Band
~$77,320
Bollinger Lower Band
~$76,799
Support
$75,500 – $76,000
Next Support
$70,000 – $72,000
The RSI sits around 47. That points to neutral, slightly weak momentum rather than a clear trend.
A break above $78,500 could open the door toward $79,500 and then $80,000. A drop below $76,000 could send price testing $75,000, and possibly $74,000 after that.
Liquidity data shows a smaller cluster around $76,500, with much bigger clusters between $78,500 and $80,000. That setup hints Bitcoin could see a small retrace before another push higher.
On-chain analyst Axel Adler Jr. flagged a shift on August 24. Short-term holder supply in profit jumped to 74.9% from 26.1% as Bitcoin climbed from $63,000 to $77,000.
That means most recent buyers now sit on gains, a condition that historically raises the odds of profit-taking.
Bitcoin also posted its largest weekly candle since 2023 and reclaimed both the Bull Market Support Band and its 200-day moving average. This same setup showed up twice in the past two bear markets. It failed in 2018 but marked the bottom in both 2019 and 2023.
Separately, Treasury Secretary Scott Bessent held a press conference Monday detailing new sanctions against Iran, targeting its oil trade and banking networks. Headlines like this can add short-term volatility to risk assets during an already heavy data week.
On the technical side, some traders are watching Bitcoin's weekly RSI. A break of its current downtrend is seen by some chart watchers as a signal that could open the door toward $100,000, though this remains a chart-based view rather than a confirmed signal.
Ethereum price prediction today
Ethereum trades around $2,444, up about 2.7% over the past day.
The rally follows a golden cross. On August 19, Ethereum's MVRV ratio crossed above its 160-day moving average, according to on-chain analyst Ali. Since then, ETH has climbed about 34%, moving from $1,905 to a recent high of $2,547.
Futures volume sits near $48.94 billion, with spot volume around $3.43 billion. Open interest stands near $31.84 billion, up 2.67%.
Ethereum's market cap is close to $296.16 billion, with a circulating supply of 120.68 million ETH, matching its total supply since ETH has no fixed max supply.
Metric
Value
ETH Price
$2,444.57
24h Change
+2.7%
Futures Volume (24h)
$48.94B
Spot Volume (24h)
$3.43B
Open Interest
$31.84B (+2.67%)
Options Volume
$1.36B
Options Open Interest
$7.08B
Circulating / Total Supply
120.68M ETH
Derivatives positioning across major exchanges looks fairly balanced, though some pockets lean bullish. The overall 24-hour long/short ratio sits at 1.0141, close to even.
On Binance, the ETH/USDT long/short ratio by accounts is higher at 2.4188, while OKX shows a ratio of 1.19. Among Binance's top traders specifically, the account-based ratio stands at 1.3546, and the position-based ratio is 1.767, both leaning toward longs.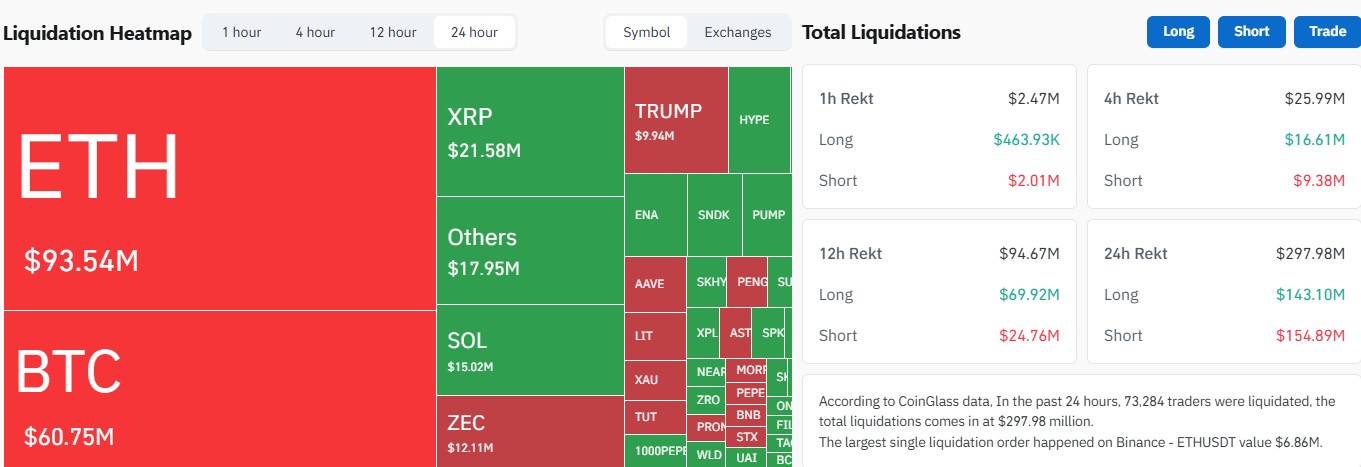
Are Ethereum whales buying or selling?
Wallet data shows accumulation. Addresses holding more than 10,000 ETH grew by 1.74%, with 17 new whale wallets joining in the past week.
Meanwhile, more than 180,764 ETH, worth close to $440 million, left exchange wallets over the same stretch. Traders often read exchange outflows as a sign holders plan to keep their coins.
What is Ethereum's next resistance level?
Ethereum's next real test sits between $2,722 and $2,970. URPD data shows roughly 16.70 million ETH were originally bought within this band, making it a heavy supply zone.
A large cluster of coins bought at one price can act like a ceiling, since many holders may sell once the price returns to their entry point.
If Ethereum clears this zone, the next MVRV pricing band points to around $5,363. A rejection and pullback toward the realized price near $2,235 also remains a reasonable outcome.
Arthur Hayes, speaking on a podcast, called Ethereum one of the more disliked large-cap altcoins right now, even though it still trades below its 2021 high. He said a move above $3,000 could open a path toward $5,000.
Trader Ted Pillows pointed out that Ethereum's drop below $1,550 earlier this year may have been a false breakdown rather than the start of a deeper decline. With that level now reclaimed, some traders believe the bottom for this cycle is already behind ETH.
Is Tom Lee turning bullish on Ethereum again?
Fundstrat's Tom Lee has added his voice to the bullish camp, pointing to early technical signs he believes could mark the start of a bigger move.
On August 17, Lee shared a chart showing Ethereum trading roughly 3.5% below the upper boundary of its daily Ichimoku Cloud, a zone that has capped ETH's price since October 2025.
A sustained close above that cloud would mark Ethereum's first such breakout in about ten months. Lee called it a development worth watching.
His bigger signal, though, was Ethereum's strength against Bitcoin. He pointed to the ETH/BTC ratio trading near 0.02994 and climbing, now back above a long-term downtrend line that weighed on Ethereum for years, and said he sees looser financial conditions ahead as a tailwind for crypto broadly.
Lee traced Ethereum's past outperformance to specific catalysts: initial coin offerings in 2017 and 2018, the NFT boom of 2020 and 2021, and the stablecoin surge of 2025. He believes the next wave could come from Wall Street's move into tokenized assets and AI agents operating on blockchains.
In a video published in July, Lee predicted Ethereum would climb back above $5,000 before the end of 2026, alongside a six-figure Bitcoin price.
Ethereum's price against Bitcoin has broken out of a multi-month downtrend, printing a higher high that some traders view as an early sign of a shift from a bearish to a bullish structure.
The breakout level sits near 0.03205, with a retest zone between 0.0260 and 0.0270. If ETH/BTC holds that zone and forms a higher low, traders are watching for a possible move toward 0.040, then 0.0500, and eventually 0.060 to 0.070. Losing that breakout structure would likely raise the risk of a failed breakout.
How much has been liquidated in the ETH market?
Short sellers have taken the bigger hit recently, with far more short positions wiped out than long positions across every timeframe tracked.
Timeframe
Total Liquidations
Longs
Shorts
1 hour
$1.56M
$296.49K
$1.26M
4 hours
$5.99M
$3.95M
$2.04M
12 hours
$26.69M
$7.38M
$19.31M
24 hours
$98.61M
$37.75M
$60.86M
XRP price prediction today
XRP trades at $1.4819, down from a recent high of $1.70.
The token climbed roughly 70% in four days from around $1, but pulled back once Bitcoin slipped below $76,000 and leveraged long positions got closed out.
Market Metric
Reported Level
Price on Aug. 24
$1.4819
Recent high
$1.70
Market capitalization
$93.24B
Open interest
$3.61B
Futures volume
$8.71B
Spot volume
$1.84B
24h liquidations
$20.57M
What are XRP's key support and resistance levels?
The first important support sits between $1.35 and $1.40, lining up with the 0.382 Fibonacci retracement zone.
Technical Area
XRP Level
Market Implication
First support
1.35–1.40
Holding here supports the recovery structure
Major resistance
$1.70
Breakout needs stronger spot demand
Near-term upside
1.80–2.00
Possible targets after confirmed breakout
Larger psychological level
$3.00
Longer-range level, not a base case
Ripple Prime, Ripple's non-bank prime brokerage arm, closed an upsized $275 million private placement of senior unsecured notes on August 18. KBRA rated the notes investment-grade BBB.
The funding adds a corporate-development angle to the XRP story, but it is not a direct XRP buying program. It's a financing deal for Ripple Prime's own business.
A possible Senate vote on the Clarity Act in mid-September is also on watch. If it advances, traders could reassess regulatory uncertainty around digital assets, though that alone would not guarantee higher prices.
What does XRP technical analysis show?
The technical picture improved after price moved above long-term resistance near $1.35, which has now become a key area for bulls to defend.
Earlier in August, $1.06 was also flagged as an important resistance level, with on-chain data showing nearly 3 billion coins had changed hands around that price. A monthly close above $1.06 was viewed as a potential path toward $1.35 and then $1.64.
A monthly Tom DeMark Sequential buy signal also points to a possible longer-term momentum shift, though past signals don't guarantee a repeat outcome.
On-chain data shows large holders accumulated more than 380 million XRP coins over one week. That kind of buildup can support a bullish case, but it should be weighed alongside exchange flows and actual spot demand.
XRP price prediction: What happens next?
The near-term setup is balanced between a healthy pullback and a possible deeper correction.
If the price holds 1.35-1.40, buyers could try to rebuild momentum toward $1.70. A breakout would need clear spot-volume confirmation to reduce the risk of another rejection.
If the altcoin loses $1.35 on strong selling, the bullish structure would become less convincing. In that case, traders may focus on whether the market can form a new base before attempting another recovery.
For now, 1.35-1.40 support and $1.70 resistance are the two levels that matter most. Bitcoin's next move and the September regulatory calendar could decide which side breaks first.
Is Wintermute betting against XRP?
On-chain tracking shows market maker Wintermute increased its Hyperliquid short exposure from about $146.19 million to $190.77 million, an increase of roughly $44.58 million.
Its top listed short positions included about $53.02 million in ETH, $30.66 million in BTC, $22.62 million in SOL, $11.43 million in HYPE, and $10.19 million in XRP, with a reported unrealized loss of about $5.85 million.
These figures cover positions visible on Hyperliquid only. They don't reveal Wintermute's full exchange-based derivatives book, and wallet transfers to exchanges don't always mean a short was opened, since funds can also be used for market making or collateral.
Total market liquidations today
The wider crypto market saw about $297.98 million in liquidations over the past 24 hours.
Asset
Liquidations
Ethereum
$93.54M
Bitcoin
$60.75M
XRP
$21.58M
Overall, $143.10 million in long positions and $154.89 million in short positions were wiped out, with 73,284 traders liquidated in total. The largest single order was an ETHUSDT position worth $6.86 million on Binance.
Bottom line for crypto traders this week
Bitcoin sits in a consolidation range between $76,000 and $78,500. Ethereum is testing the lower edge of a heavy supply zone near $2,722. XRP is fighting to hold $1.35 to $1.40 after its sharp pullback from $1.70.
The PCE report on Wednesday and Warsh's tone on Friday are likely to decide which way these levels break. A dovish signal could support further upside. A hawkish one could send prices back toward recent lows.
Disclaimer
This article is for informational purposes only and does not constitute financial, investment, or trading advice. Cryptocurrency markets are highly volatile, and prices can change rapidly. Past performance does not guarantee future results. Always conduct your own research and consult a licensed financial advisor before making any investment decisions.