Key Takeaways HYPE was rejected again at the 0.236 Fib near $67.8, breaking below its local trendline with the 50-day SMA at $65.32 as the holding support. RWA open interest on Hyperliquid re
Key Takeaways
- HYPE was rejected again at the 0.236 Fib near $67.8, breaking below its local trendline with the 50-day SMA at $65.32 as the holding support.
- RWA open interest on Hyperliquid reached a record $3.6 billion, with total OI at $11 billion, a 2026 high.
- Hyperliquid Strategies and Hyperion are the only digital asset treasuries with positive unrealized PnL, per Artemis data.
Another Rejection, but the Uptrend Keeps Its Floor
The chart shows a token stuck between a ceiling that keeps working and a floor that has not failed. Coindoo owner Filip Vantchev wrote on X that HYPE “continues to get rejected at the 0.236 Fib Resistance,” near $67.8, and that the rejection combined with a break below the local trendline “shifts momentum slightly in favor of the bears.” The qualifier matters: the 50-day moving average at $65.32 is still providing support, price is sitting almost exactly on it, and the broader uptrend from the $35.74 base remains intact.

Daily Hyperliquid/USD technical chart.
Vantchev’s two scenarios bracket the range:
- Bullish scenario: A break above the 0.236 Fib near $67.8, followed by a successful retest as support, could extend the uptrend toward the previous highs near $76.90.
- Bearish scenario: If the 50-day SMA at $65.32 fails to hold, HYPE could pull back toward $62, where the 0.382 Fib provides the next major support.
With the daily RSI near 49, momentum is neutral enough that neither scenario carries a head start.
The decline is probably not entirely HYPE-specific. It also reflects the broader macro backdrop, with Bitcoin itself breaking below its rising channel and adding pressure across the sector.
The tension in the setup is that the business metrics point the opposite direction from the price. Hyperliquid wrote on X that real-world asset open interest on the platform reached a new all-time high of $3.6 billion, while total open interest hit $11 billion, its highest level of 2026. The RWA figure is the more strategic of the two: it means the venue best known for crypto perpetuals is becoming a meaningful derivatives market for tokenized traditional assets, the fastest-growing segment of the year, and doing it in the same month Robinhood Chain briefly took its daily DEX volume crown.
The link between those records and the token is mechanical rather than sentimental. Hyperliquid routes the overwhelming majority of its trading fees into its Assistance Fund, which continuously buys HYPE on the open market, so rising open interest feeds directly into a structural, volume-driven bid under the token. Record OI does not guarantee a rally, but it raises the floor the buybacks build over time, which is part of why the 50-day has held every test of this advance so far.
READ MORE:
 Bitcoin’s Bottom Hunt: What 4 Market Signals Show
The Only Treasuries Above Water
The third dataset explains who is not being forced to sell. Artemis data shows that among digital asset treasury companies, only Hyperliquid Strategies and Hyperion hold positions with positive unrealized PnL, while the rest of the sector, led by Strategy’s roughly $9.8 billion paper loss, sits underwater on its average cost basis.
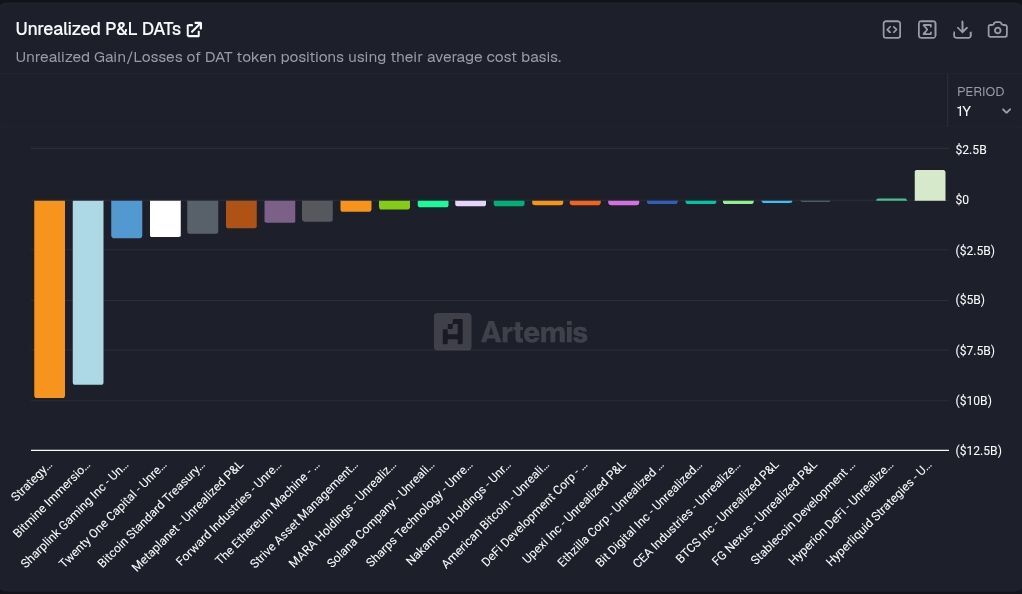
For HYPE, that detail removes a supply risk that currently hangs over Bitcoin and Ethereum: treasuries in profit face no balance-sheet pressure to liquidate, unlike the distressed cohort whose possible selling the broader market can start to price in.
The combination frames the week ahead simply. The token has record platform usage, a mechanical buyback bid, and profitable treasury holders stacked against a chart that keeps failing at $67.8. The daily close could provide the first hint about direction, while tomorrow’s U.S. CPI release may determine whether the broader macro backdrop reinforces or reverses that signal.
The information provided in this article is for informational purposes only and does not constitute financial, investment, or legal advice. Cryptocurrency investments carry a high level of risk, and readers should conduct their own research and consult a professional advisor before making any investment decisions. Coindoo is not responsible for any losses incurred as a result of actions taken based on the content of this article.The post HYPE Price Analysis Shows Bearish Momentum appeared first on Coindoo.