HYPE is trading around $70.81 right now, up 3.24% on the day, and the chart underneath that move is doing something worth slowing down for. Any real HYPE price prediction 2026 has to start wi
HYPE is trading around $70.81 right now, up 3.24% on the day, and the chart underneath that move is doing something worth slowing down for.
Any real HYPE price prediction 2026 has to start with the trendline this coin has been riding since May, because that's what's actually driving the setup right now, not the daily green candle.
Key Market Snapshot
Metric
Value
Coin
Hyperliquid (HYPE)
Current Price
$70.81
24h Change
+3.24%
Market Cap
$15.75B
24h Volume
$352.32M
Total Supply
955,307,079
Circulating Supply
222,445,714
Only about 23% of total supply is circulating, so a chunk of future token unlocks is still sitting ahead, and that's a factor worth keeping in the back pocket even when the near-term chart looks clean.
HYPE Price Prediction 2026: What the Liquidations Are Really Saying
According to CoinGlass liquidation data, HYPE saw $2.20M in total liquidations over the past 24 hours, and $1.98M of that, close to 90%, came from short positions getting flushed out. 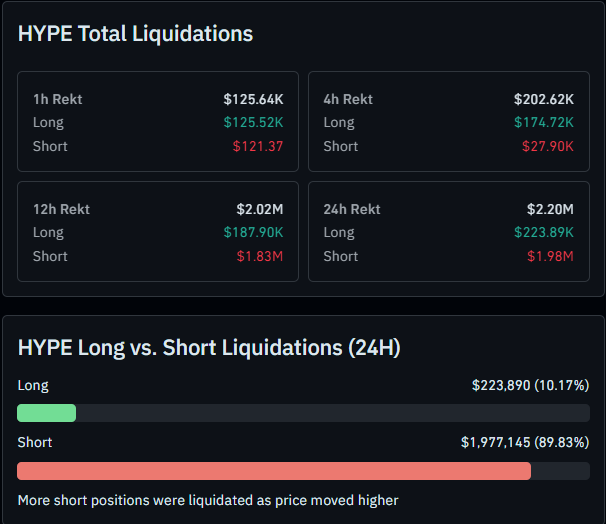
Over the 12-hour window it's a similar story: $1.83M out of $2.02M in liquidations came from shorts.
That's a clean signal on its own; traders betting against $HYPE kept getting run over as the price pushed higher through the day.
But look closer at the shorter windows, and the picture flips.
In the last 4 hours, longs took the bigger hit at $174.72K against just $27.90K for shorts, and in the last hour it's longs again, $125.52K versus a tiny $121.37 from shorts.
That's the market cooling off right near resistance; some of the recent buyers are getting shaken out as price stalls, which lines up exactly with where this chart currently sits.
Whale Activity: Bridged Inflows Are Piling Into $HYPE
There's fresh money backing this setup too.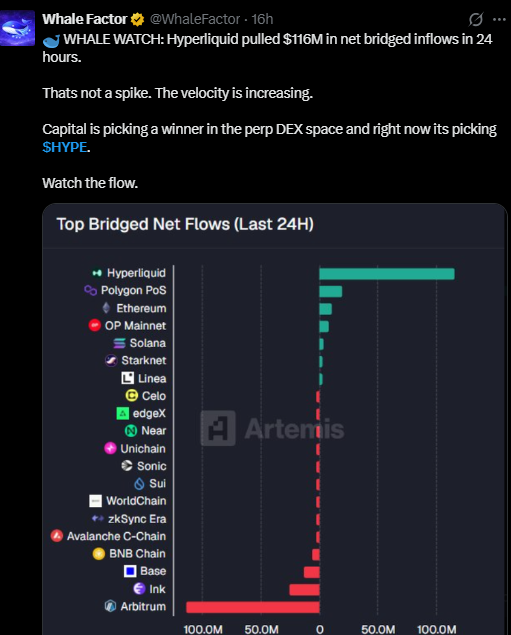
As per Whale Factor on X, $116M in net bridged inflows into Hyperliquid over the past 24 hours, calling it rising velocity rather than a one-off spike.
On the broader bridged flows chart, Hyperliquid sits well ahead of every other chain, while names like Arbitrum, Base, and BNB Chain are actually seeing net outflows.
Capital rotating in like this, right as price tests resistance, adds real weight behind the breakout case.
$HYPE Price Prediction 2026: Technical Forecast Here's the structure that matters.
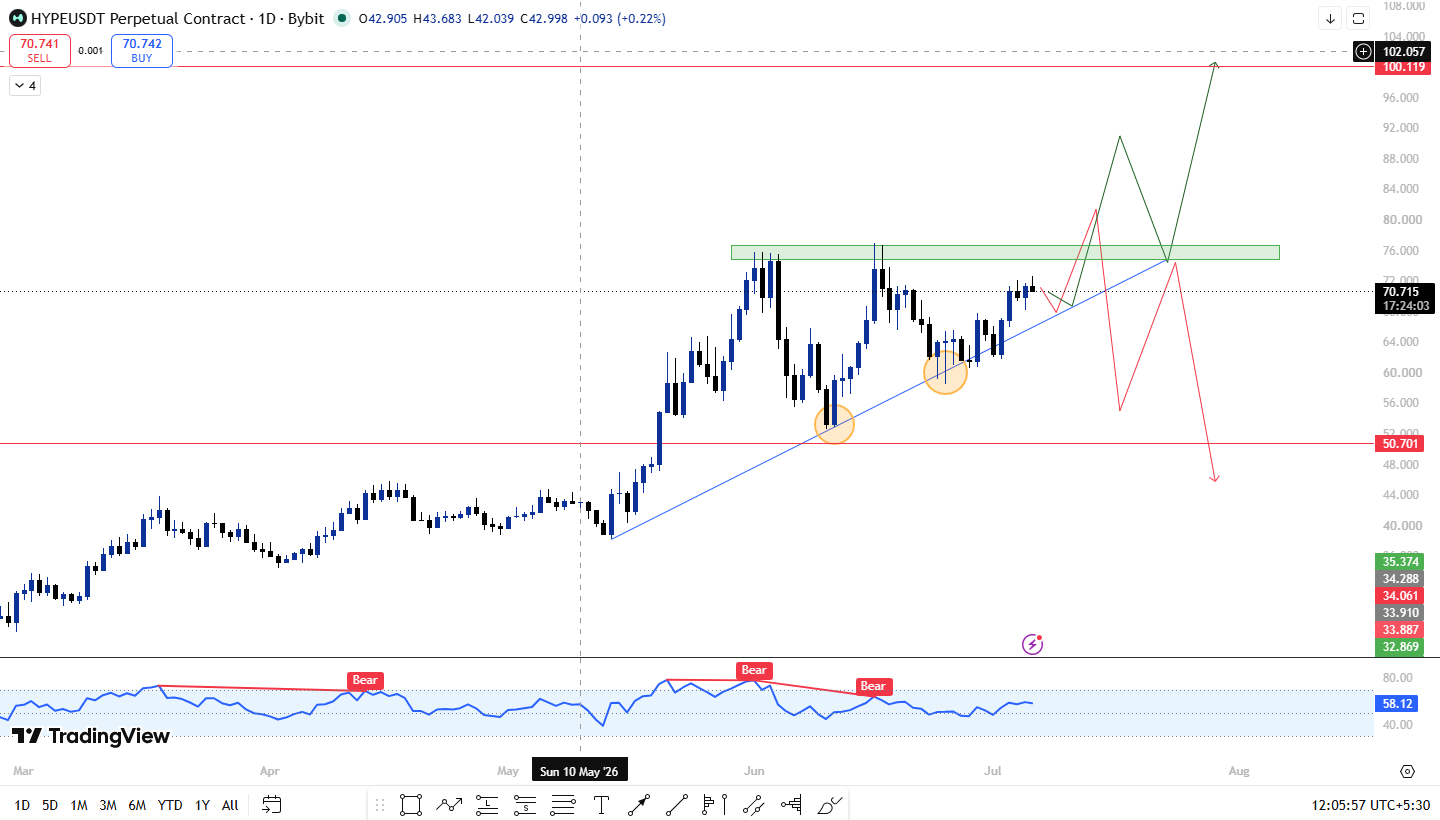
On the daily timeframe, HYPE has been climbing off a rising trendline since May, and price keeps finding support right at that line every time it gets tested.
Two clear bounces off that trendline are visible on the chart, and each one has held without breaking down.
Right now, price is running into a horizontal resistance zone sitting just above current levels, roughly the $73 to $76 area.
What's notable is how the selling here is behaving. Every time the price gets pushed into that resistance, sellers show up, but they aren't strong enough to actually carve out a lower low underneath.
The pullbacks are shallow, and the trendline keeps catching price before it can break down.
That's a meaningful detail for this setup. Weak selling at resistance, combined with a trendline that keeps holding, usually means the market is absorbing supply rather than losing steam.
If that continues, the price has room to grind higher and eventually clear that resistance rather than roll over.
$HYPE Price Prediction 2026: What Happens If This Breaks Higher
If HYPE clears the horizontal resistance zone and holds above it on a daily close, with the trendline still intact underneath, the chart points toward a run at the $100 level.
That's the standout target in this breakout scenario, and it lines up with the natural extension above the current resistance shelf.
Getting a confirmed daily close above resistance is the key trigger here. Without that close, the setup stays range-bound between the trendline and resistance rather than actually breaking out.
HYPE Price Prediction 2026: What Happens If Selling Continues
The other side of this setup matters just as much.
If price gets rejected at resistance and that rejection comes with a strong closing wick, the kind that shows sellers stepping in hard rather than just fading, the trendline that's been holding since May becomes the level at risk.
A break of that trendline would open the door to a much deeper move. The chart shows this playing out as a slide back down toward the $50 region, which would mean giving back a large chunk of the rally built since May.
That's the scenario the downside case is watching for, and a wick-heavy rejection at resistance is the early warning sign to track.
HYPE Price Prediction 2026: Halving Cycles and the CLARITY Act
Two broader pieces are worth folding into any long-term outlook here, even though neither is specific to this token.
Bitcoin's halving cycle tends to set the tone for risk appetite across the wider market, and the 12 to 18 months following a halving have historically leaned bullish for majors and higher-beta alts alike.
HYPE, as a newer and more volatile name, would likely see an outsized version of that tailwind if the pattern holds.
The CLARITY Act, the US framework working to define which digital assets fall under SEC versus CFTC oversight, matters here too.
Perpetuals-focused platforms like Hyperliquid sit closer to the regulatory line than most spot-traded tokens, so clearer rules could either open the door to more institutional participation or create short-term uncertainty depending on how HYPE's specific model gets classified.
Between the two, regulatory clarity probably carries more weight for HYPE specifically, given how central derivatives trading is to its whole business model.
The halving effect is more of a rising tide that lifts the broader market, HYPE included, rather than something unique to this token.
Hyperliquid Forecast 2026 : Bullish vs Bearish Scenarios
Hyperliquid Bullish Scenario : HYPE holds the rising trendline, grinds through the $73 to $76 Supply zone on a confirmed daily close, and pushes toward $100 as the next major level and then more higher. This is the strongest version of the bull case.
Bearish scenario: HYPE gets rejected at resistance with a strong wick, the trendline breaks down, and price slides back toward the $50 region as the rally since May unwinds.
Where the odds sit: The weak selling pressure at resistance and the trendline's track record of holding both favor the bullish case slightly more right now, but this is still an unconfirmed setup.
Until there's an actual daily close above resistance, the range between the trendline and resistance is where price is most likely to keep chopping.
Invalidation: This is a technical read based on current chart structure, not a guarantee. Liquidation-driven swings can move fast in either direction, so every level in this HYPE price prediction 2026 breakdown should be treated as a probability, not a promise.
Disclaimer: Cryptocurrency investments carry risk and can be highly volatile. This HYPE Price Prediction 2026 article is intended for informational purposes only and should not be considered financial advice. Always conduct independent research before making investment decisions.