Hyperliquid price prediction is in focus again as $HYPE finds itself testing the exact same trendline it broke down from just a short while ago. This kind of retest moment tends to be one of
Hyperliquid price prediction is in focus again as $HYPE finds itself testing the exact same trendline it broke down from just a short while ago.
This kind of retest moment tends to be one of the more telling points on a chart, because how price behaves right here often decides whether the recent breakdown was the start of something bigger or just a shakeout before another leg up.
HYPE coin price prediction watchers are paying close attention right now, since the next few candles could set the tone for where this move goes next. Here is the full breakdown.
HYPE Price Today: Live Data and 24-Hour Change
$HYPE is trading at $81.872 at the time of writing, down 1.3%, a drop of $1.1036 over the past 24 hours.
Futures volume over the same period stands at a sizable $4.46 billion while spot volume sits at $264.75 million, showing that this move is being driven almost entirely by leveraged positioning.
Market cap is holding at $20.65 billion, open interest is at $3.41 billion, and circulating supply is 251.76 million HYPE against a total and max supply of 952.11 million tokens.
Source: CoinGlass, August 29, 2026.
Hyperliquid Latest News and Catalyst
On-chain activity is adding an interesting layer to this Hyperliquid price forecast.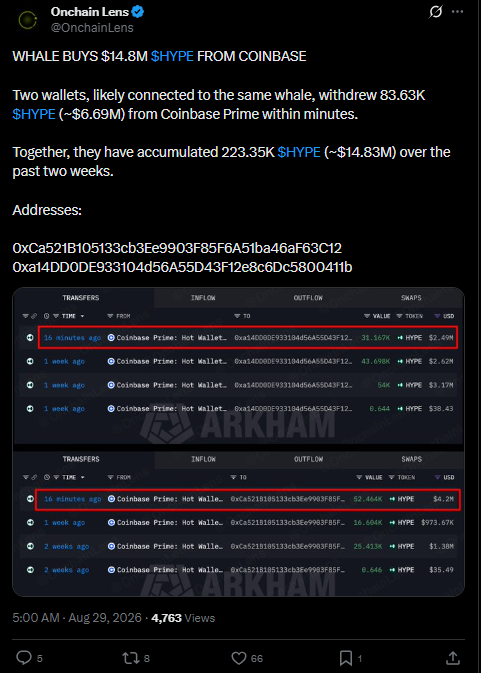
According to a report from Onchain Lens, a whale bought $14.8 million worth of HYPE from Coinbase, with two wallets believed to be connected to the same entity withdrawing 83.63K HYPE, worth roughly $6.69 million, from Coinbase Prime within minutes of each other.
Combined, these wallets have accumulated 223.35K HYPE, worth close to $14.83 million, over the past two weeks.
Accumulation of this size from a single entity often gets read as a sign of conviction, even if it does not guarantee an immediate price reaction.
Source: Onchain Lens on X, August 29, 2026.
HYPE Liquidation Data and Market Positioning
Liquidation activity over the past day has clearly favored shorts, which lines up with the trendline retest currently playing out.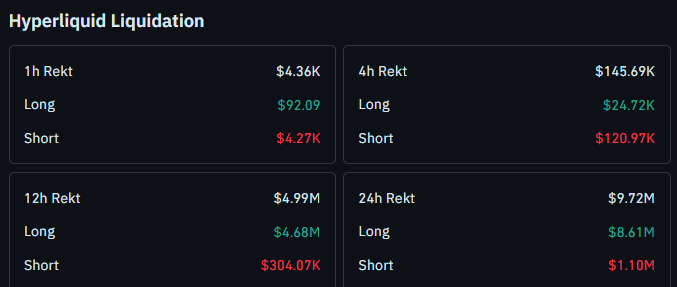
Over the last 24 hours, $9.72M in positions were liquidated, with $8.61M coming from longs against $1.10M from shorts.
The 12-hour window shows a similar skew: $4.99M total rekt, $4.68M of that from longs versus $304.07K from shorts.
In the most recent 4-hour window, $145.69K was liquidated overall, and this time shorts took the bigger hit at $120.97K against $24.72K from longs, suggesting the recent bounce briefly caught short sellers off guard.
Source: CoinGlass liquidation data, August 29, 2026.
Quick Take
CMP: $81.872 on the 1-hour Binance perpetual chart
Bullish trigger: 1 hour close above $86.823 needed to confirm reversal off this trendline retest
Bullish continuation levels: $91.995 (1.618 fib extension), then $100.307 (2.618 fib extension)
Bearish trigger: 1 hour close below $78.573
Bearish target on breakdown: $76.682
Data timestamp: August 29, 2026, 11:28 UTC+5:30
Risk note: HYPE is retesting a trendline it already broke down from, so this is a level where the next move could turn either way, and closing confirmation matters more than a quick wick through either side
Hyperliquid Technical Outlook August 2026
The 1-hour HYPE/USDT perpetual chart on Binance shows the price breaking down from an ascending trendline it had been respecting for several sessions, and it is now back at that same trendline for a retest.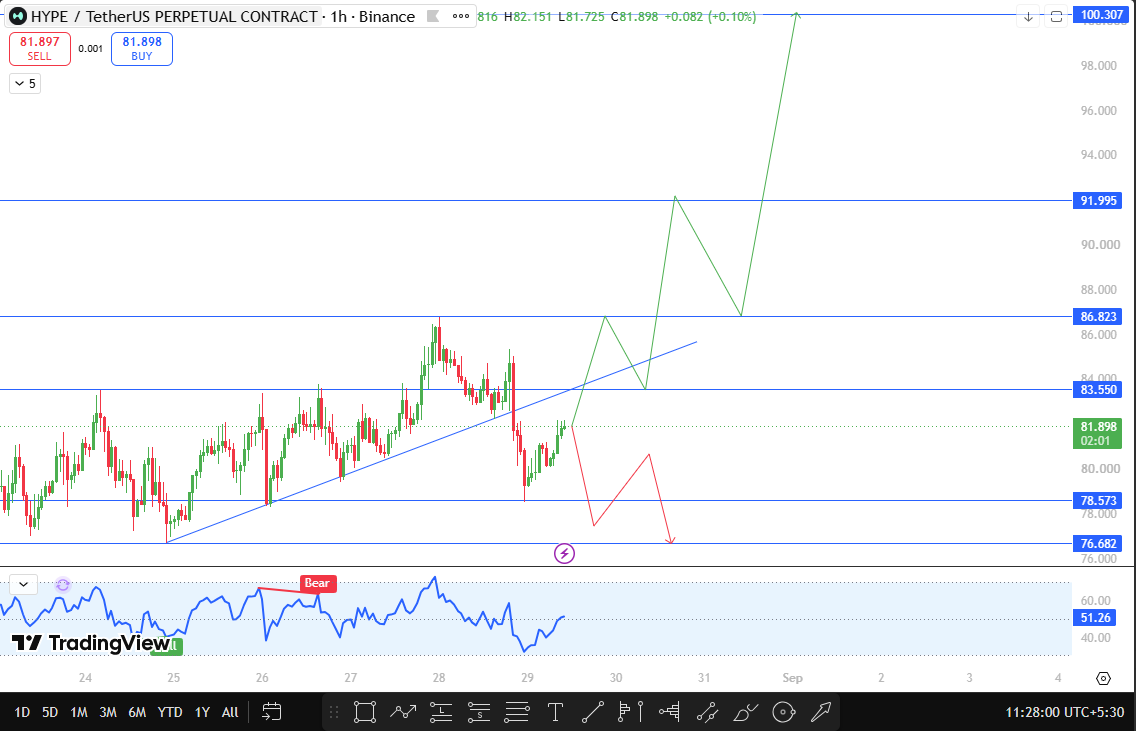
This is a fairly classic setup in Hyperliquid technical analysis: a break followed by a return to the broken level, where the market essentially decides whether that former support flips into resistance or gets reclaimed.
If this retest fails to hold as resistance and HYPE manages a reversal, the first real confirmation would come from a 1-hour close above $86.823.
A close there opens the door toward $91.995, which lines up with the 1.618 fibonacci extension, and if buying pressure keeps building beyond that, $100.307, the 2.618 extension, becomes the next objective in play.
On the other side, if HYPE fails to reclaim the trendline and instead closes below $78.573 on the 1-hour timeframe, that would confirm sellers remain in control.
In that case, the next support to watch drops to $76.682, an old swing level from earlier price action.
Given that this is a live retest of a broken trendline, either outcome could develop quickly, so this HYPE support and resistance setup is worth watching closely over the next several sessions.
Source: TradingView, HYPE/USDT Perpetual, 1-hour chart, Binance, August 29, 2026.
HYPE Support and Resistance Levels
Level Type
Price
Note
Resistance 3
$100.307
2.618 fib extension, old swing high
Resistance 2
$91.995
1.618 fib extension, old swing high
Resistance 1
$86.823
Confirmation level for trendline reversal
Current Price
$81.872
CMP on 1-hour chart, trendline retest zone
Support 1
$78.573
Old swing support
Support 2
$76.682
Old swing low
Bull, Base, and Bear Case for HYPE
In the bull case, $HYPE holds the trendline retest, closes above $86.823, and pushes toward $91.995 with $100.307 as the extended target if the fib extension levels get taken out.
The base case has $HYPE chopping around this retest zone for a bit longer without a clean 1-hour close on either side, essentially letting the market decide which way this breaks.
In the bear case, the trendline retest fails outright, $HYPE closes below $78.573, and price works toward a retest of $76.682, confirming the earlier trendline breakdown as the dominant structure.
Risks to This Hyperliquid Price Prediction
The main risk here is that a trendline retest like this can resolve quickly once it breaks in either direction, leaving little room to react.
Broader market conditions, including sudden shifts in Bitcoin or overall risk appetite in crypto, could easily override this HYPE breakout prediction regardless of what the chart itself is showing.
This analysis is based purely on current chart structure and available data, and conditions can change fast.
Glossary
CMP: Current Market Price, the price at which an asset is trading right now.Trendline Retest: When a price returns to a previously broken trendline to test whether it now acts as support or resistance.Fibonacci Extension: A technical tool used to project potential price targets beyond a prior move, based on key Fibonacci ratios like 1.618 and 2.618.Liquidation: The forced closing of a leveraged position when losses exceed the trader's available margin.
Disclaimer
This article is for informational purposes only and should not be considered financial advice. Cryptocurrency markets are highly volatile, and readers should conduct their own research before making any investment decisions.