Can INJ defend the $6.611 support level, or will sellers push the price toward $6.359? This Injective price prediction begins with $INJ trading well below its recent highs. the latest drop sh
Can INJ defend the $6.611 support level, or will sellers push the price toward $6.359?
This Injective price prediction begins with $INJ trading well below its recent highs. the latest drop shifted attention from upside targets, covered in theInjective breakout analysis, to the $6.611 support level. Buyers have stepped in at that price before.
Where Does INJ Stand Right Now?
CoinGecko market data ranks INJ at 87th by market cap.
Metric
Value
Price
$6.63
24h change
-5.6%
Market cap
$662.903M
Market cap rank
87th
Fully diluted valuation (FDV)
$662.903M
24h trading volume
$105.35M
Circulating supply
100M INJ
Perps 24h open interest
$185.152M
Source: CoinGecko, $INJ market data, captured Nov 20, 2026, 04:31 UTC.
FDV is the value of every token at today's price. INJ fell 5.6% over 24 h and lost 3.0% against BTC, so INJ lags and weighs on the INJ price forecast.
What Does Injective News Mean for INJ?
Tokenized real estate means a digital token that stands for a real-world property loan record. Per theofficial Injective X post, over $1.5B in mortgages are tokenized on the network, with PentivHQ (NYSE: PTIV) adding $524.8M in one day.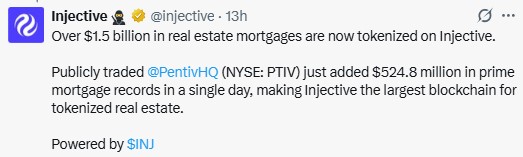
Source: Official Injective X post, captured Nov 20, 2026, 04:31 UTC
A secondInjective X post says USDC, a stablecoin issued on Injective, now stands at $42M.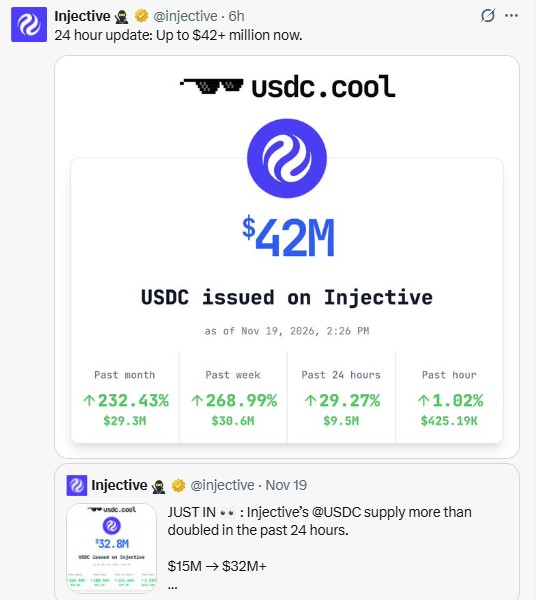
Source: Official Injective X post with usdc.cool figures, captured Nov 20, 2026, 04:31 UTC.
Both pieces of Injective News are project claims under a day old. And the price still fell 5.6% over 24 hours, so traders can follow thecrypto news feed for fresh catalysts. More tokenized assets could add demand, but without buyers at $6.611, a drop toward $6.359 stays possible.
What Does INJ Liquidation Data Show?
TheCoinGlass futures page shows $INJ liquidation data with longs taking the hit. Over 1h, longs lost $11.60K and shorts lost $0.00. Over 4 hours, Longs lost $261.23K.
Over 12h, longs lost $332.84K and shorts lost $7.14K. And over 24h, longs lost $485.42K against $67.73K for shorts.
Longs made up about 88% of the $553.15K total over 24h. Forced long exits add sell orders. With shorts at $0.00 over 1 h, no squeeze is driving price, which keeps sellers ahead in this injective price prediction.
What's Happening With INJ Open Interest?
Open interest is the total value of futures contracts still open. CoinGlass puts total INJ open interest at $118.69M, down 34.05% from the start of the chart range.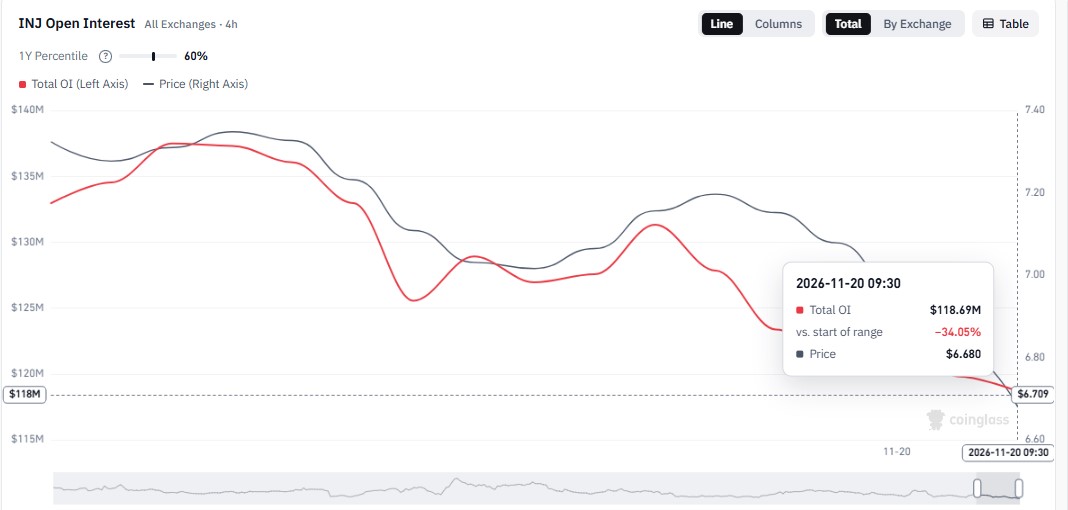
Source: CoinGlass, $INJ open interest across all exchanges, 4H chart, captured Nov 20, 2026, 04:31 UTC
Falling open interest with falling price means traders are cutting positions, not adding them. Traders can also compare the earlierInjective ETF rally analysis. Rising open interest with a daily candle trading above $6.984 would show buyers adding positions. A daily candle trading below $6.611 opens the way to $6.359.
Injective Price Prediction: Technical Chart Analysis
The Binance 4H chart for $INJ/USDT on TradingView frames this Injective price prediction. A rally pushed $INJ past $8.371 levels before sellers took control.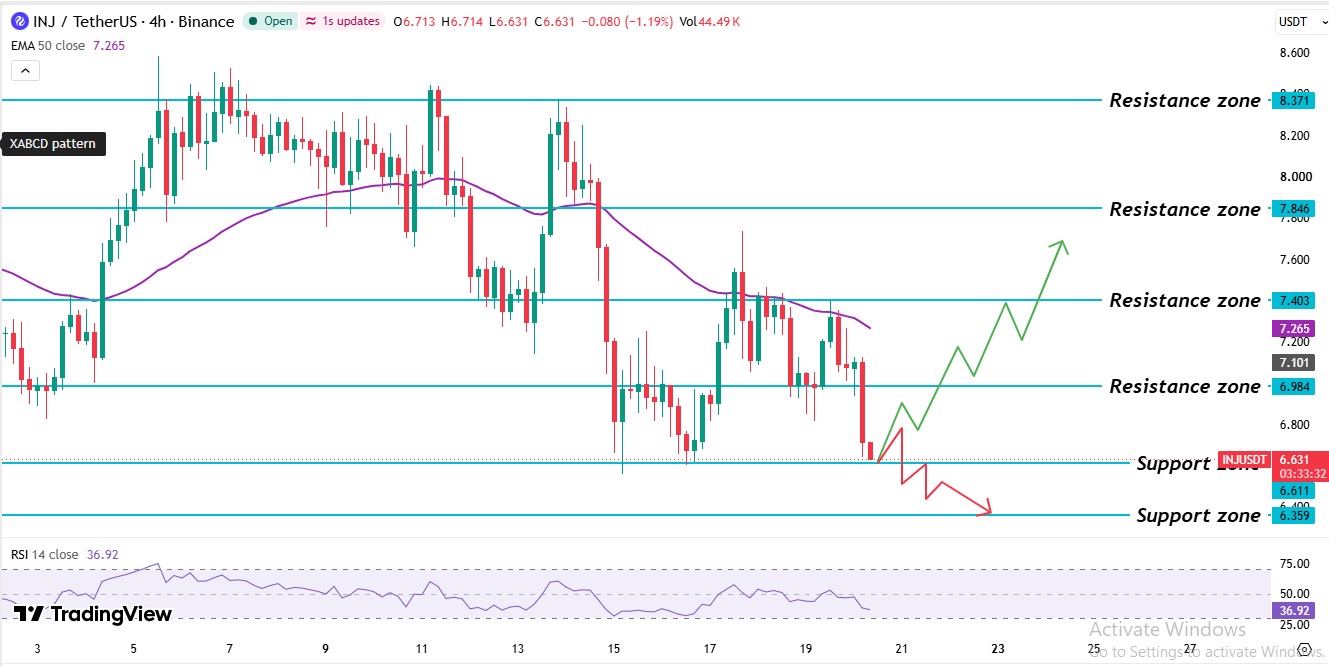
Source: TradingView, Binance $INJ/USDT 4H chart with EMA 50 and RSI 14, captured Nov 20, 2026, 04:31 UTC
The climb began just under the $6.984 level, and buyers pushed the price up through the $7,846 level. Price then hit the $8.371 resistance level and failed to hold above it three times.
Then sellers broke the price down through $7.846, and the role flipped, because that former support level now acts as a resistance level. The price lost the 50 EMA level. The sell-off ran to the $6.611 support level, and bounces toward the $7.403 resistance level and the EMA have failed twice.
The latest 4H candles now test the $6.611 support level. Traders can set this beside an earlierInjective support analysis to compare levels. Right now, $INJ trades just above the $6.611 support level, under the $6.984 resistance level and below the 50 EMA level.
The $INJ 4-hour 50 EMA sits at $7.265. INJ's $6.63 price trades below it, and the EMA sits 9.6% above that price. The $7.403 resistance level sits just above it, so a real recovery needs a daily candle trading above both levels.
The $INJ RSI reads 36.92 on the 14-period setting. Under 50, sellers hold the edge. Above 30, oversold conditions haven't formed, so price has room to fall, while under 30 selling has gone too far and a bounce is possible.
Support and Resistance Levels
Level
Type
$8.371
Resistance level
$7.846
Resistance level
$7.403
Resistance level
$7.265
4-hour 50 EMA
$6.984
Resistance level
$6.611
Support level
$6.359
Support level
A support level is where buyers step in, and a resistance level is where sellers do.
INJ Price Forecast: Bull, Base, and Bear Scenarios
Scenario
Trigger
Target
Invalidation
Bull
Daily candle above the $7.265 EMA level
$7.403, then $7.846
Falls back below the 50 EMA level
Base
Price stays between $6.611 and $6.984.
Sideways trade in that range
Daily candle breaks either level.
Bear
Daily candle below $6.611
$6.359
Daily candle above the $7.265 EMA level
A regulatory delay for tokenized assets could cool demand for Injective. A daily candle above the $7.265 EMA would break the bearish case, while one below $6.611 would confirm it.
Can INJ Reach $10 From Here?
Reaching $10 needs a 50.8% gain from the current price. The price must clear the $6.984 resistance level and the 50 EMA level first. Resistance levels at $7.403 and $7.846 follow. The $8.371 level sits above those, and the chart's peak stayed below $8.60.
Open interest at $118.69M is down 34.05%, so positioning is shrinking, not building.
What Is the Expert Outlook on INJ Levels?
As per CoinGabbar analysis, this Injective price prediction leans bearish for the week. The RSI at 36.92 and a price below the $7.265 4-hour 50 EMA both show sellers holding the edge.
But the news hasn't helped yet, since the price still fell 5.6% over 24 hours while USDC supply reached $42M. The condition to monitor is a daily candle trading below the $6.611 support level, which would confirm sellers are heading lower.
Disclaimer: This article is for information only and isn't financial advice. Traders should do their own research and risk only what they can afford to lose.