Injective price prediction watchers are looking at one of the more stubborn resistance battles in the mid-cap market right now. A single narrow zone has flipped from support to resistance and
Injective price prediction watchers are looking at one of the more stubborn resistance battles in the mid-cap market right now.
A single narrow zone has flipped from support to resistance and is now being tested for close to the fifth time, and each attempt so far has ended the same way.
The levels discussed below come from the 1-hour $INJ perpetual chart and reflect a short-term view.
If the price closes meaningfully outside the ranges mentioned here, this injective price prediction would need to be rechecked against the updated chart.
Injective (INJ) Price Right Now
Metric
Value
Current Price (CMP)
$4.463
24-Hour Change
+0.61% (+$0.02703)
Market Cap
$445.94M
Futures Volume (24h)
$81.86M
Spot Volume (24h)
$18.54M
Open Interest
$86.96M
Circulating Supply
99.97M INJ
Total Supply
100.00M INJ
Max Supply
Not applicable
Open interest is the total value of outstanding INJ futures contracts that have not yet been closed or settled.
At $86.96M against a $445.94M market cap, open interest represents a meaningful share of INJ's total value, which helps explain why the flip zone discussed in this INJ technical analysis keeps getting rejected so cleanly.
Chart source: TradingView, INJ/TetherUS Perpetual Contract, Binance, 1-hour timeframe, captured 11 August 2026, 03:00 PM IST (09:30 AM UTC). Data source: CoinGlass, Injective market page, captured 11 August 2026, 03:00 PM IST.
Methodology and Data Sources
The technical structure in this injective price prediction comes from an independent reading of the INJ 1-hour perpetual chart on Binance, covering the flip-zone and the horizontal levels marked on it.
Market figures such as volume, open interest, and supply data are pulled from CoinGlass. Liquidation numbers are sourced from CoinGlass's liquidation tracker for INJ.
INJ Liquidation Data Today
Liquidation flow on INJ has been heavily skewed toward longs across nearly every timeframe, a detail worth flagging for this Injective rally prediction.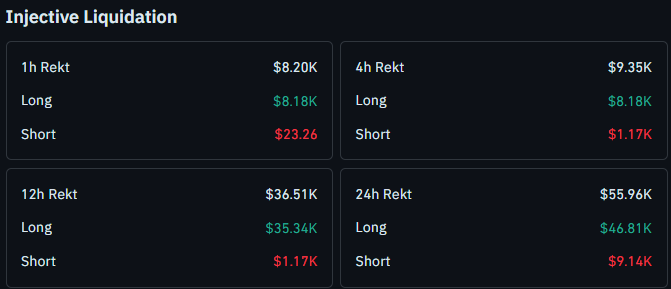
Over the last hour, total liquidations reached $8.20K, with $8.18K coming from longs against just $23.26 from shorts.
The 4-hour window shows $9.35K in total liquidations, made up of $8.18K in longs and $1.17K in shorts.
Over 12 hours, rekt totals climb to $36.51K, with $35.34K from longs and $1.17K from shorts.
The 24-hour figure reaches $55.96K, split between $46.81K in longs and $9.14K in shorts.
Longs have taken the brunt of the pain in every single window here, which fits a market where repeated attempts to break through the flip zone have kept catching leveraged buyers offside.
Source: CoinGlass, INJ liquidation data, captured 11 August 2026.
Injective Trend and Momentum: Key Takeaways
INJ is trading at 4.463, right at a flip zone spanning 4.462 to 4.476
This zone acted as support three separate times before the price broke below it
Since flipping to resistance, the zone has rejected price close to five times, including one failed breakout attempt on the fourth test
A close above the flip zone on a strong volume candle would open the door to 4.571, 4.756, and eventually 5.157
A close below 4.361 would signal a deeper breakdown, with 4.280 as the next support
Leveraged positions around any of these zones carry real liquidation risk, as the data above shows. These are chart-based levels, not guarantees.
Injective Price Prediction: 1-Hour Chart Analysis
Price is currently trading right around a tightly defined flip zone between 4.462 and 4.476, and the history of this exact zone is what makes the current setup worth watching closely in this price prediction.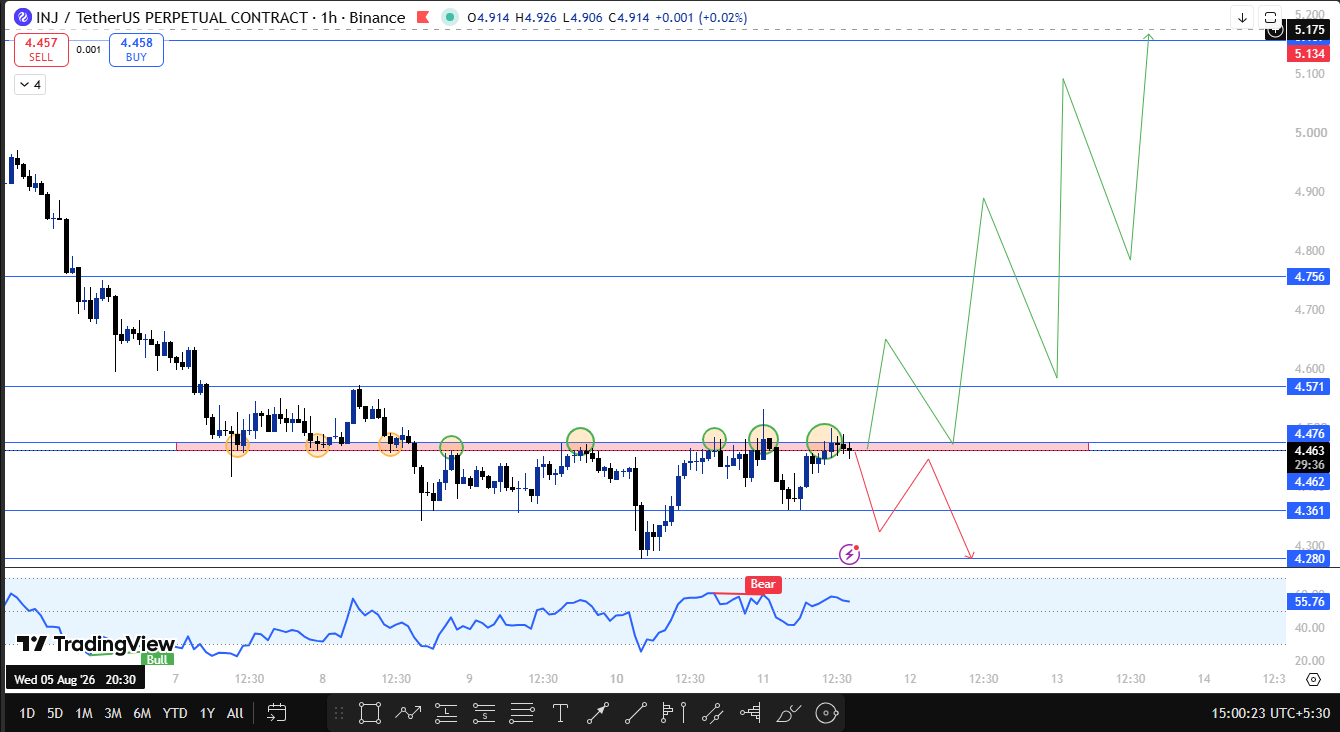
Price used this same range as support three separate times before eventually breaking down through it.
Once that support gave way, the zone flipped roles. Since then, INJ has come back up to test it as resistance close to five times.
One of those attempts, the fourth retest, actually pushed through briefly in an effort to break out, but it could not sustain above the zone and slipped back down. INJ is now sitting at the same level again, attempting yet another test.
A confirmed breakout here would need more than just a close above the zone. This INJ technical analysis specifically flags that the move should come on a strong volume candle to be considered credible, given how many times this level has rejected price already.
If that happens, the first resistance above becomes 4.571, roughly 2.5% above CMP, followed by 4.756 near 6.7% higher, and an extended target at 5.157 close to 15.7% above CMP.
On the downside, the flip zone holding as resistance keeps the near-term bias capped.
A close below 4.361, about 2.2% under CMP, would suggest sellers are back in control, and the next support in this Injective forecast sits at 4.280, roughly 4% below CMP.
Injective Technical Outlook Snapshot
Indicator
Signal
Price Structure
Flip zone 4.462 to 4.476, tested as resistance roughly five times after three prior supports
Momentum Oscillator
Reading near 55.76, a bear tag appeared near the recent high.
Immediate Bias
Neutral, capped by repeated flip zone rejection
Bullish Trigger
Close above the 4.462 to 4.476 zone on a strong volume candle.
Bearish Trigger
1H close below 4.361
Invalidation
1H close below 4.361
Support and Resistance Levels to Watch
Type
Level
Note
% From CMP
Resistance
$5.157
Extended breakout target
+15.7%
Resistance
$4.756
Breakout target if the flip area clears
+6.7%
Resistance
$4.571
First resistance after flip area breakout
+2.5%
Flip Zone
$4.462 to $4.476
Former support, now resistance, tested roughly five times.
0% to +0.4%
Current Price
$4.463
Live CMP
0%
Support
$4.361
Breakdown trigger
-2.2%
Support
$4.280
Next support if 4.361 breaks
-4.0%
Scenario Table
Case
Trigger
Target
Bullish breakout
Close the above flip area on strong volume.
4.571, then 4.756, then 5.157
Bearish breakdown
1H close below 4.361
4.280
Setup invalidation
1H close below 4.361
Flip area resistance confirmed; near-term bias turns bearish.
Invalidation Level
This injective price prediction treats a 1-hour close below 4.361 as invalidation for the bullish breakout thesis.
Below that level, the case for INJ finally clearing its flip area weakens considerably, and the setup would need a fresh reassessment toward 4.280.
Trading leveraged positions around the flip area carries genuine risk.
A breakout without strong volume has already failed once on the fourth retest, and the liquidation data above shows how quickly long positions have been getting caught out during these repeated rejection attempts.
How Bitcoin Could Influence Injective
INJ's ability to finally clear its flip area will likely depend on more than just its own chart.
A stable or rising Bitcoin would give this INJ breakout analysis a better chance of seeing the strong volume candle needed to confirm a move above 4.476.
A risk off shift in Bitcoin sentiment, on the other hand, would make another failed retest and a slide toward 4.361 more likely, extending the pattern that has played out over the last several attempts.
Planned Update
This injective price prediction will be revisited if INJ closes an hourly candle beyond either the flip area or 4.361, or if no clear resolution happens within the next 24 hours of trading.
A sudden spike in liquidation volume or a confirmed high-volume breakout candle would also be a reason to update this INJ trend analysis sooner.
Glossary
Flip Zone: A price range that has switched roles between support and resistance, often tested repeatedly from both sides before a decisive breakout or breakdown.
Open Interest: The total value of outstanding futures or perpetual contracts that have not yet been settled or closed.
Liquidation: The forced closure of a leveraged trading position by an exchange when losses erode the trader's margin below a required threshold.
Volume Candle: A price candle accompanied by unusually high trading volume, often used to confirm whether a breakout or breakdown is genuine.
Invalidation Level: The price point at which a technical setup or forecast is considered no longer valid, prompting a reassessment of the outlook.
CoinGabbar's Technical Analyst View
Bull Case: Price finally clears the 4.462 to 4.476 flip area on a strong volume candle, confirming the fifth retest succeeded where the fourth failed, with momentum carrying the price toward 4.571, 4.756, and potentially 5.157.
Base Case: Price continues testing the flip area without a confirmed volume breakout, extending the current rejection pattern in a tight range just below resistance.
Bear Case: Price closes below 4.361, confirming the flip area has held firmly as resistance, and slides toward 4.280 next.
Disclaimer
This Injective price prediction is prepared for informational purposes only and should not be treated as financial or investment advice. Cryptocurrency markets, including INJ, are highly volatile, and leveraged trading carries a significant risk of loss, including the risk of liquidation as shown in the data above. Readers should conduct their own research and consult a qualified financial advisor before making any investment decisions. CoinGabbar and the analyst preparing this piece do not hold a position at the time of publication.