Injective price prediction chatter is picking up fast this week. A fresh report about $INJ landing on Robinhood has traders reaching for the charts again. At the same time, the token is sitti
Injective price prediction chatter is picking up fast this week. A fresh report about $INJ landing on Robinhood has traders reaching for the charts again.
At the same time, the token is sitting right at a key spot on its own chart. That combination is what everyone is trying to figure out right now.
Injective's move is not happening in isolation. As per CoinMarketCap, the total crypto market cap stands at $2.19T, up 1.15% over the past 24 hours.
Bitcoin (BTC) is trading at $63,924.69, up 1.76% on the day. Ethereum is trading near $1,843.56, up 0.88% in the same window.
A greener broader market usually gives altcoins more room to run when BTC and ETH both hold gains.
Why Is INJ Price Up Today?
$INJ is trading near $5.10 today, up 5.04% in the last 24 hours. This move is feeding directly into the broader INJ price prediction story building around the Robinhood report.
Injective (INJ) Market Snapshot
Current valuation, liquidity and token supply overview.
Current Price $5.10 ▲ +5.04% Market Cap $509.13M Unlocked Market Cap $509.26M 24H Trading Volume $116.07M +8.67% Volume / Market Cap 23.15% Token Supply Total Supply
100M INJCirculating
99.97M INJ 99.97% Circulating Fully Diluted Valuation $509.3M
Volume climbing faster than price is usually a healthy sign. It means real buying interest is showing up, not just a thin move on low liquidity.
What Is the INJ Robinhood Listing News?
A crypto tracking account, MSB Intel on X, posted that $INJ had been listed on Robinhood on July 17. This claim is what kicked off the latest round of buying interest around Injective.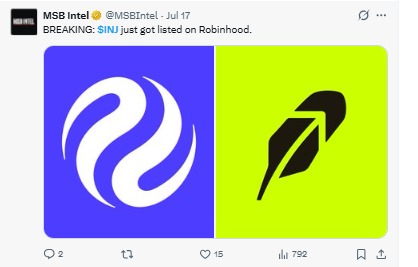
Traders chasing this $INJ Robinhood listing news should wait for that official word before pricing it in fully.
What Is Injective's SEC Transfer Agent Filing?
Injective's verified official account on X confirmed something more solid on July 16. The project has filed transfer agent registration with the SEC.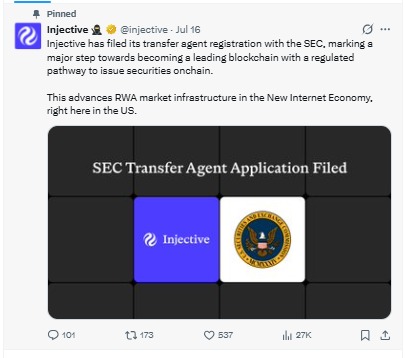
Robinhood has officially confirmed this listing through its own channels. This $INJ Robinhood listing is now live for spot trading on Robinhood Crypto for eligible US users.
The confirmed $INJ Robinhood listing has not sparked a strong price reaction so far, suggesting the market may have already priced in the news.
INJ Liquidation Data
As per the CoinGlass data, two-sided pressure is building on $INJ over the past 24 hours. Longs and shorts are both getting hit, not just one side.
Injective Liquidation Dashboard
Breakdown of total, long and short liquidations across multiple timeframes.
1H Total Liquidations $5.61 Long $5.61Short $0 4H Total Liquidations $4.89K Long $4.27KShort $617.51 12H Total Liquidations $33.62K Long $7.45KShort $26.17K 24H Total Liquidations $70.51K Long $28.83KShort $41.68K
Positioning still leans bullish though. 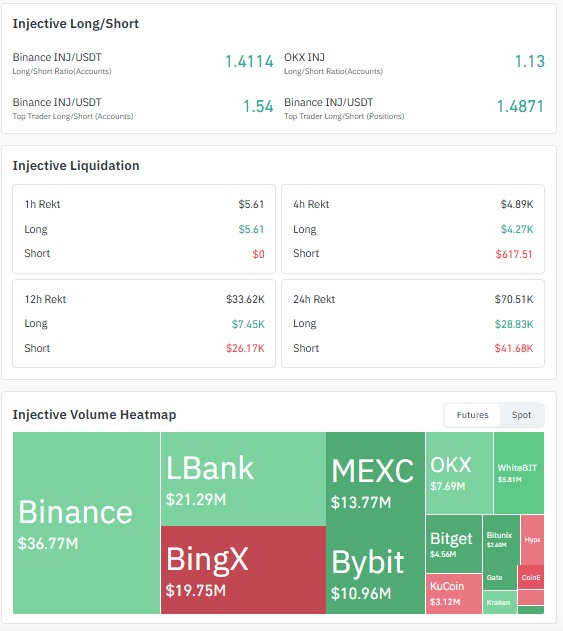
Binance's top trader long/short ratio sits at 1.4871 on positions and 1.54 on accounts, while OKX shows a more modest 1.13.
Injective Trading Volume Data
On Coinglass data, Binance is doing most of the heavy lifting on volume, which usually means it is also leading price discovery.
Injective 24H Exchange Volume
Top exchanges by daily INJ trading volume.
RankExchange24H Volume1
Binance$36.77M2
LBank$21.29M3
BingX$19.75M4
MEXC$13.77M5
Bybit$10.96M6
OKX$7.69M
Injective's market cap sits near $509.13M with a circulating supply of roughly 99.97M INJ.
$INJ Technical Analysis: Rising Wedge and EMA Crossover
As per the TradingView chart, $INJ has been trading inside a rising wedge on the four-hour timeframe. Price has respected both the lower and upper edges of this $INJ rising wedge cleanly.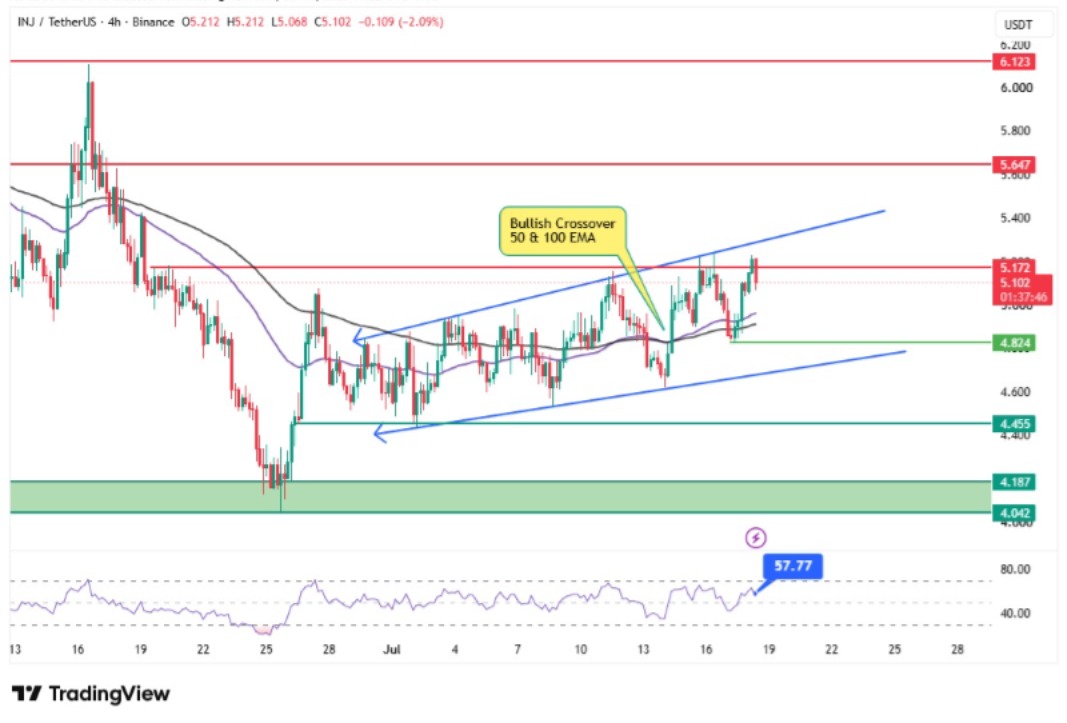
Right now, price is sitting near $5.10, close to the upper edge and just under immediate resistance at $5.17.
An Injective bullish crossover on the 50 and 100 EMA has just formed at this same spot, which is what is fueling short-term optimism.
RSI is reading 57.77 on this INJ technical analysis. That is nowhere near overbought, so there is still room for price to move before momentum runs out.
$INJ Price Prediction: Short-Term Levels
If price gets rejected at the wedge's upper edge, a retest of the EMAs is the likely first move. $4.824 is the immediate support below that.
A clean break above the wedge opens $5.647 as the first target. $6.123 comes next if buyers keep control.
On the downside, if $4.824 fails and the wedge structure breaks down, $4.455 is the next support. Below that, $4.187 to $4.042 is the deeper demand area.
LevelPriceTypeBreakout Target 1$5.647ResistanceBreakout Target 2$6.123ResistanceImmediate Support$4.824SupportSecondary Support$4.455SupportDemand Zone$4.187 – $4.042Support
These are the key Injective support resistance levels to track over the next few sessions, and together they form the core price target range for now.
Injective Price Prediction 2026: Long-Term Outlook
Zooming out changes the picture a bit. If INJ can hold above $6.123 rather than just tag it once, the longer $INJ price forecast opens toward $7 and then $8.90.
That kind of move would likely need broader market strength behind it too, not just this week's news alone.
On the other side, a break below $4 on higher timeframes would be a real warning sign for the near-term INJ price outlook.
That could expose the $3.3 to $3 zone as the next lower demand area for this $INJ price prediction 2026 outlook.
Injective Price Prediction: Bull Case vs Bear CaseCaseScenarioPrice LevelBull CaseWedge breaks out, EMA crossover holds, and buying pressure continues.Short Term:$5.647 → $6.123Long Term:$7.00 – $8.90Base CasePrice remains range-bound inside the wedge between EMA support and upper resistance.$4.824 – $5.172Bear CaseWedge breaks down and the $4.824 support level fails to hold.Short Term:$4.455Support Zone:$4.187 – $4.042Long Term:$3.30 – $3.00Injective Price Analysis: Expert Opinion
As per the CoinGabbar market analyst, this Injective price analysis points to a genuine decision point, not a confirmed breakout.
This INJ price analysis leans on the wedge, the EMA crossover, and the Robinhood report, all pulling sentiment in one direction.
None of them alone confirms a sustained move, though. Analysts view the SEC filing as the more durable of this week's two headlines, since it comes directly from Injective's own channel.
A break and hold above $5.172, not just a brief touch, is generally seen as the level that would validate this Injective price target technically.
Disclaimer: This article is for informational purposes only and does not constitute financial advice. Cryptocurrency markets are highly volatile, and prices can move sharply in either direction. Readers should conduct their own research and consult a qualified financial advisor before making any investment decisions. CoinGabbar does not guarantee any price outcome mentioned in this INJ price prediction.