Key Highlights BTC is trading near $57,720 after sweeping to an intraday low of $55,170 on November 21, as $2.55 billion was liquidated across crypto in 24 hours. Bitcoin's own liquidations w
Key Highlights
BTC is trading near $57,720 after sweeping to an intraday low of $55,170 on November 21, as $2.55 billion was liquidated across crypto in 24 hours. Bitcoin's own liquidations were $1.15 billion, 89.4% of them longs.
Spot Bitcoin ETFs recorded a $1.12 billion weekly net outflow for the week ending November 19, with total assets under management down to $76.55 billion.
The key chart is the weekly falling wedge flagged by @CryptoFaibik. The $55K zone sits on its lower boundary, and a reclaim of $70K-$72K is needed to confirm a breakout.
Bitcoin dipped to $55,170 on November 21 and bounced back above $57,000. The move came with a leveraged long flush, a third straight look at ETF outflows, and a risk-off tape across equities. The bottom is not confirmed. Price has only reached the level the weekly chart is built around.
CoinGlass data shows $2.55 billion liquidated across crypto in 24 hours.
Asset
Liquidated
Long share
Bitcoin
$1.15B
89.4%
Ethereum
$582.85M
85.4%
The largest single order was a $51.71 million BTCUSDT long on Binance. The heatmap shows dense clusters near the lows, consistent with leveraged longs forced out as price swept below $56K. The move was driven more by forced long selling than by fresh short positioning.
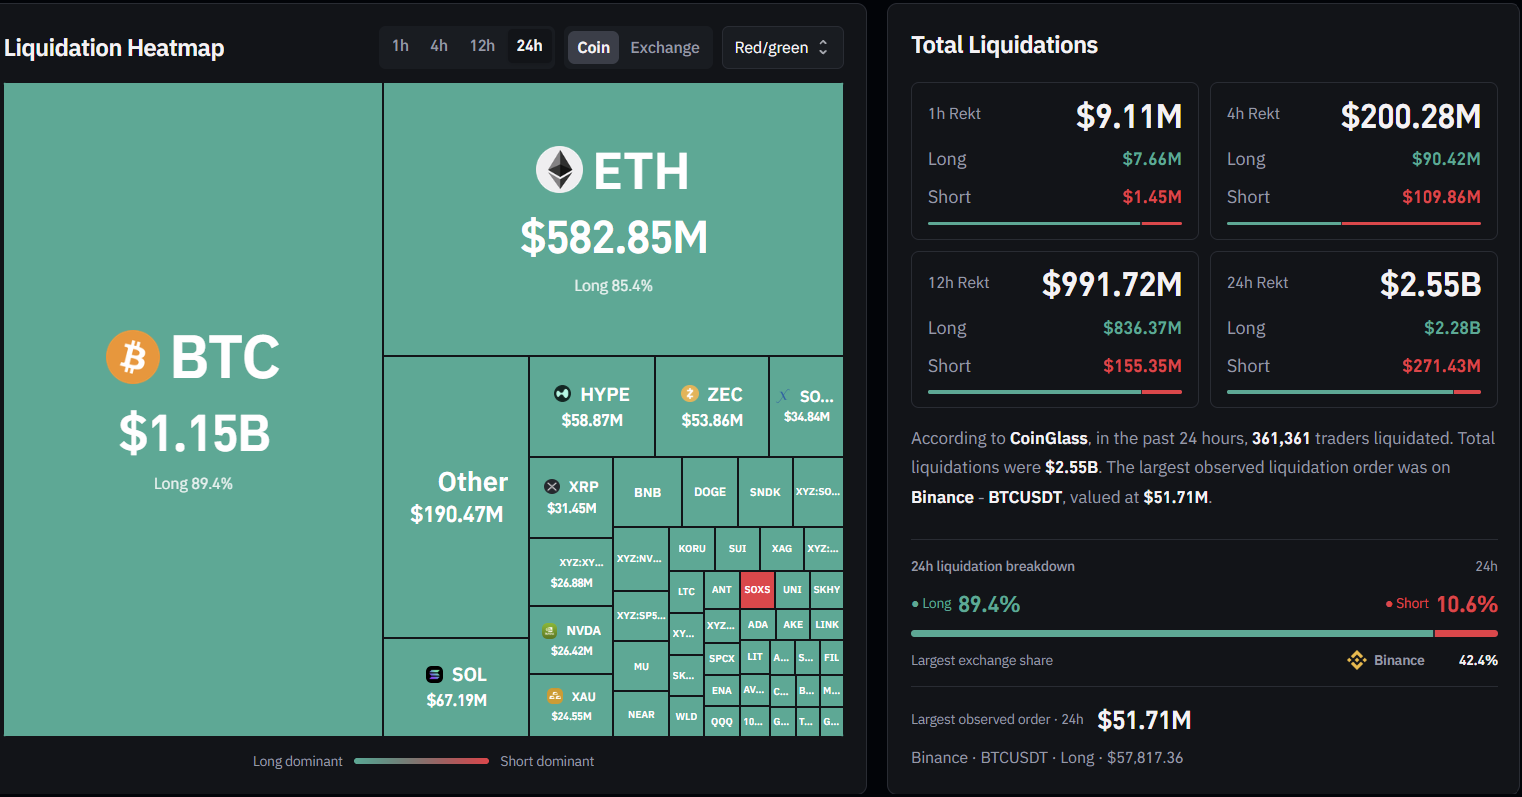
Liquidation Heatmap on 21 Nov 2026 | Source: Coinglass
Our earlier read on whale selling accelerating near $55K with no buyer absorption flagged this zone under heavy supply. The buy/sell pressure delta breaking below zero showed the pressure building before the sweep.
Per SoSoValue, spot Bitcoin ETFs saw a $1.12 billion weekly net outflow for the week ending November 19. Cumulative net inflows since launch stand at $53.51 billion, and total assets under management have fallen to $76.55 billion.
The outflow streak removes a source of institutional demand that supported earlier corrections. Without it, dips have less of a bid underneath them.
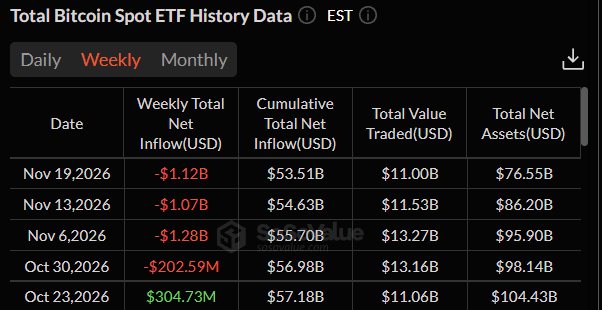
Bitcoin Spot ETF Data | Source: Sosovalue
The sell-off was not crypto-specific. Tech and AI equities fell sharply, with the Nasdaq down more than 4% in recent sessions. Rising real yields and a hawkish shift in Fed expectations have pressured risk assets, and markets are pricing a high probability of a rate hike at the December 9 FOMC.
Weaker ETF demand, leveraged long liquidations, and a risk-off backdrop combined to produce the weekend flush.
@CryptoFaibik’s weekly BTCUSDT chart shows price compressing inside converging trendlines since the October 2025 highs. The $55,170 low sat on the lower boundary.
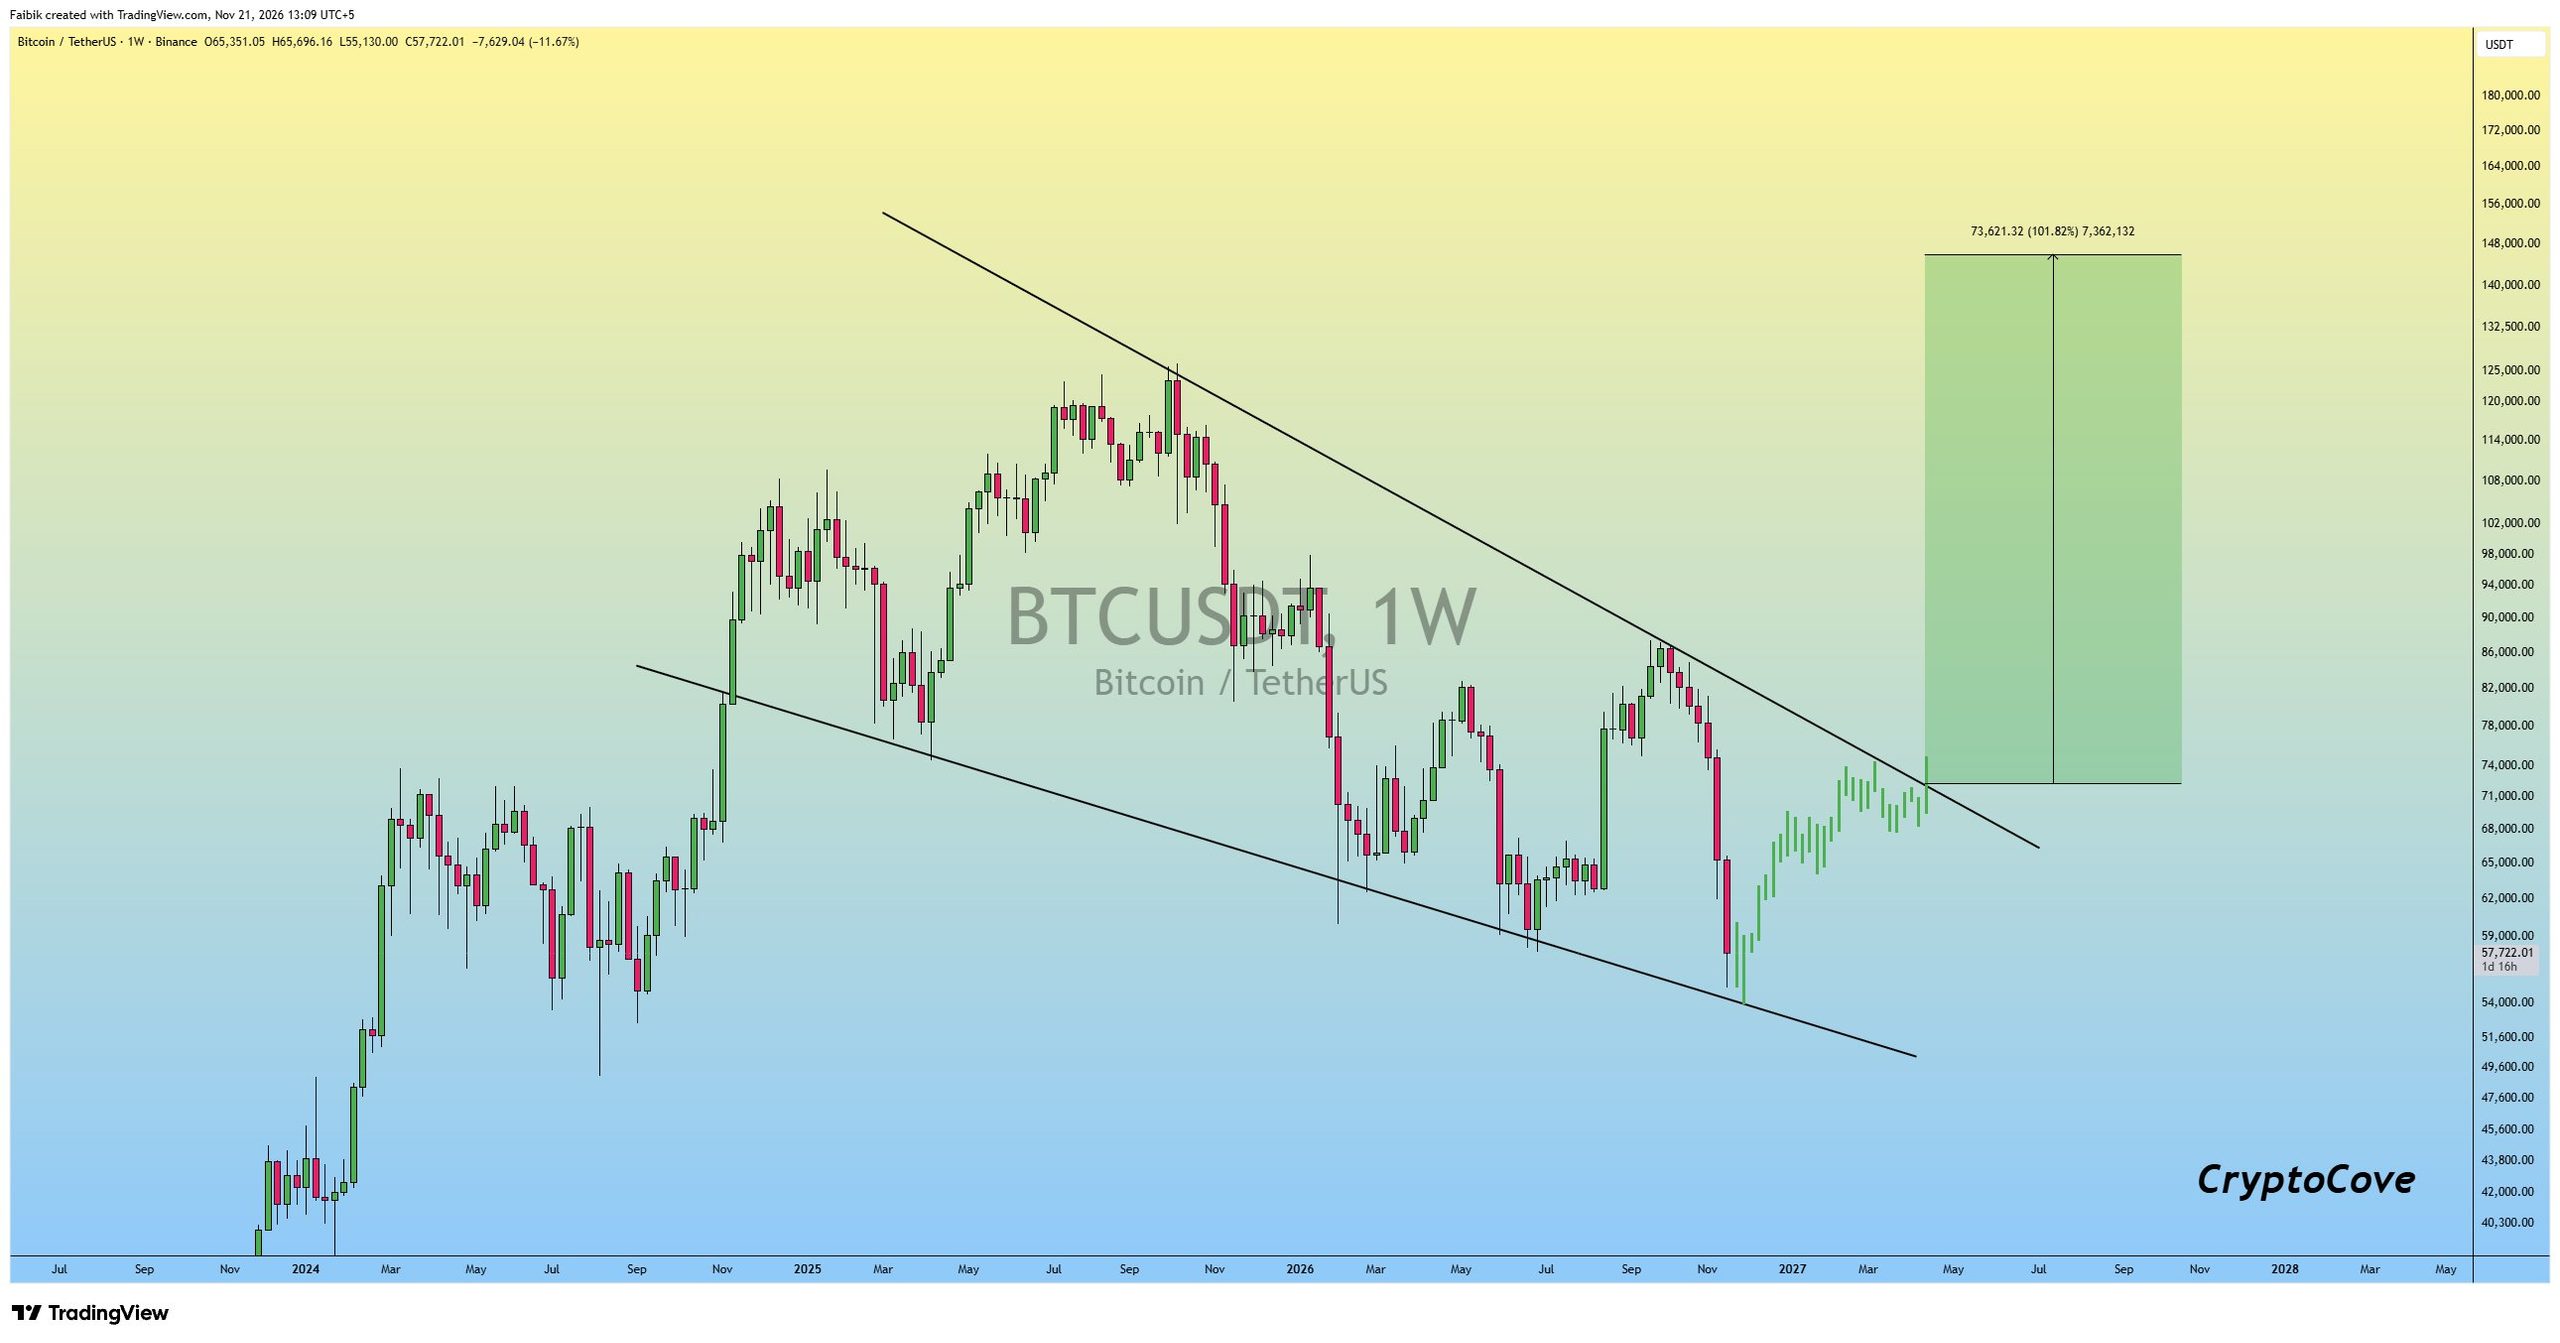
BTC Weekly Chart | Source: @CryptoFaibik (X)
His read: “Bitcoin appears to have bottomed out near the 55k zone.” Bulls need to reclaim the $70K-$72K resistance zone to confirm the next major move. A green target zone on the chart runs from roughly $74K to $145K, the projected measured move if the wedge breaks upward. He believes a breakout could start the 2027 bull run.
Until $70K-$72K is reclaimed, the pattern remains in formation.
What to Watch
Hold $55,170 on a daily close. The wedge stays intact while price remains inside the trendlines.
Reclaim $70K-$72K for the first structural confirmation.
Lose the lower wedge boundary and the setup is invalidated, opening lower targets.
At $57,720, Bitcoin has bounced off the level that matters but sits well below the resistance that confirms it. ETF flows and the December 9 FOMC are the next pressure points.
Disclaimer: The views and analysis presented in this article are for informational purposes only and reflect the author’s perspective, not financial advice. Technical patterns and indicators discussed are subject to market volatility and may or may not yield the anticipated results. Investors are advised to exercise caution, conduct independent research, and make decisions aligned with their individual risk tolerance.
Also Read: Bitcoin Whale Selling Accelerates Near $55K as Alpha Footprint Flags No Buyer Absorption