Render trades at around $1.39 on 16 November 2026. That puts RENDER roughly 46 percent below its twelve-month high of $2.59, set on 12 January 2026, and about 15 percent above its twelve-mont
Render trades at around $1.39 on 16 November 2026. That puts RENDER roughly 46 percent below its twelve-month high of $2.59, set on 12 January 2026, and about 15 percent above its twelve-month low of $1.21 from 19 December 2025. Over 30 days the token has lost around 29 percent, over a year around 33 percent. The autumn rally that carried the price above $2.10 in early October has been given back in full. Is Render a good buy at current prices, or are you trying to catch a falling knife?
cryptoticker.io compiled the price data itself on 16 November 2026 and calculated the moving averages, the RSI and the twelve-month levels from the daily closing prices published by CoinMarketCap.
Render price analysis: where RENDER sits between the August low and the 200-day line
The current price of $1.39 sits below both key averages. The exponential 200-day moving average runs at $1.67, roughly 20 percent above the price. The 50-day moving average stands at $1.66, just beneath it. With a market capitalisation of around $775 million, Render ranks 65th on CoinMarketCap.
Four levels shape the chart. The current zone between $1.36 and $1.42 only formed over the weekend: on 15 November RENDER closed at $1.36, its lowest daily close since mid-September. Below that lies the September low of $1.32 from 16 September, the launch pad of the last rally. The next support is the August low at $1.25, followed by the twelve-month low of $1.21. On the upside, the price first has to reclaim the area around $1.50, where it found a floor several times in late October and early November. Above that waits the band formed by the 50-day and 200-day averages between $1.66 and $1.67.
Is Render's downtrend broken or merely interrupted?
The past five months follow a clear sequence. From early June to mid-August Render fell from just over $2.15 to $1.25, and from mid-June onwards it traded below its 200-day average throughout. From 16 September came a steep breakout: within three weeks RENDER climbed from $1.32 to $2.14 on 7 October, a gain of around 62 percent. On 4 October the 50-day average crossed above the 200-day average, a so-called golden cross.
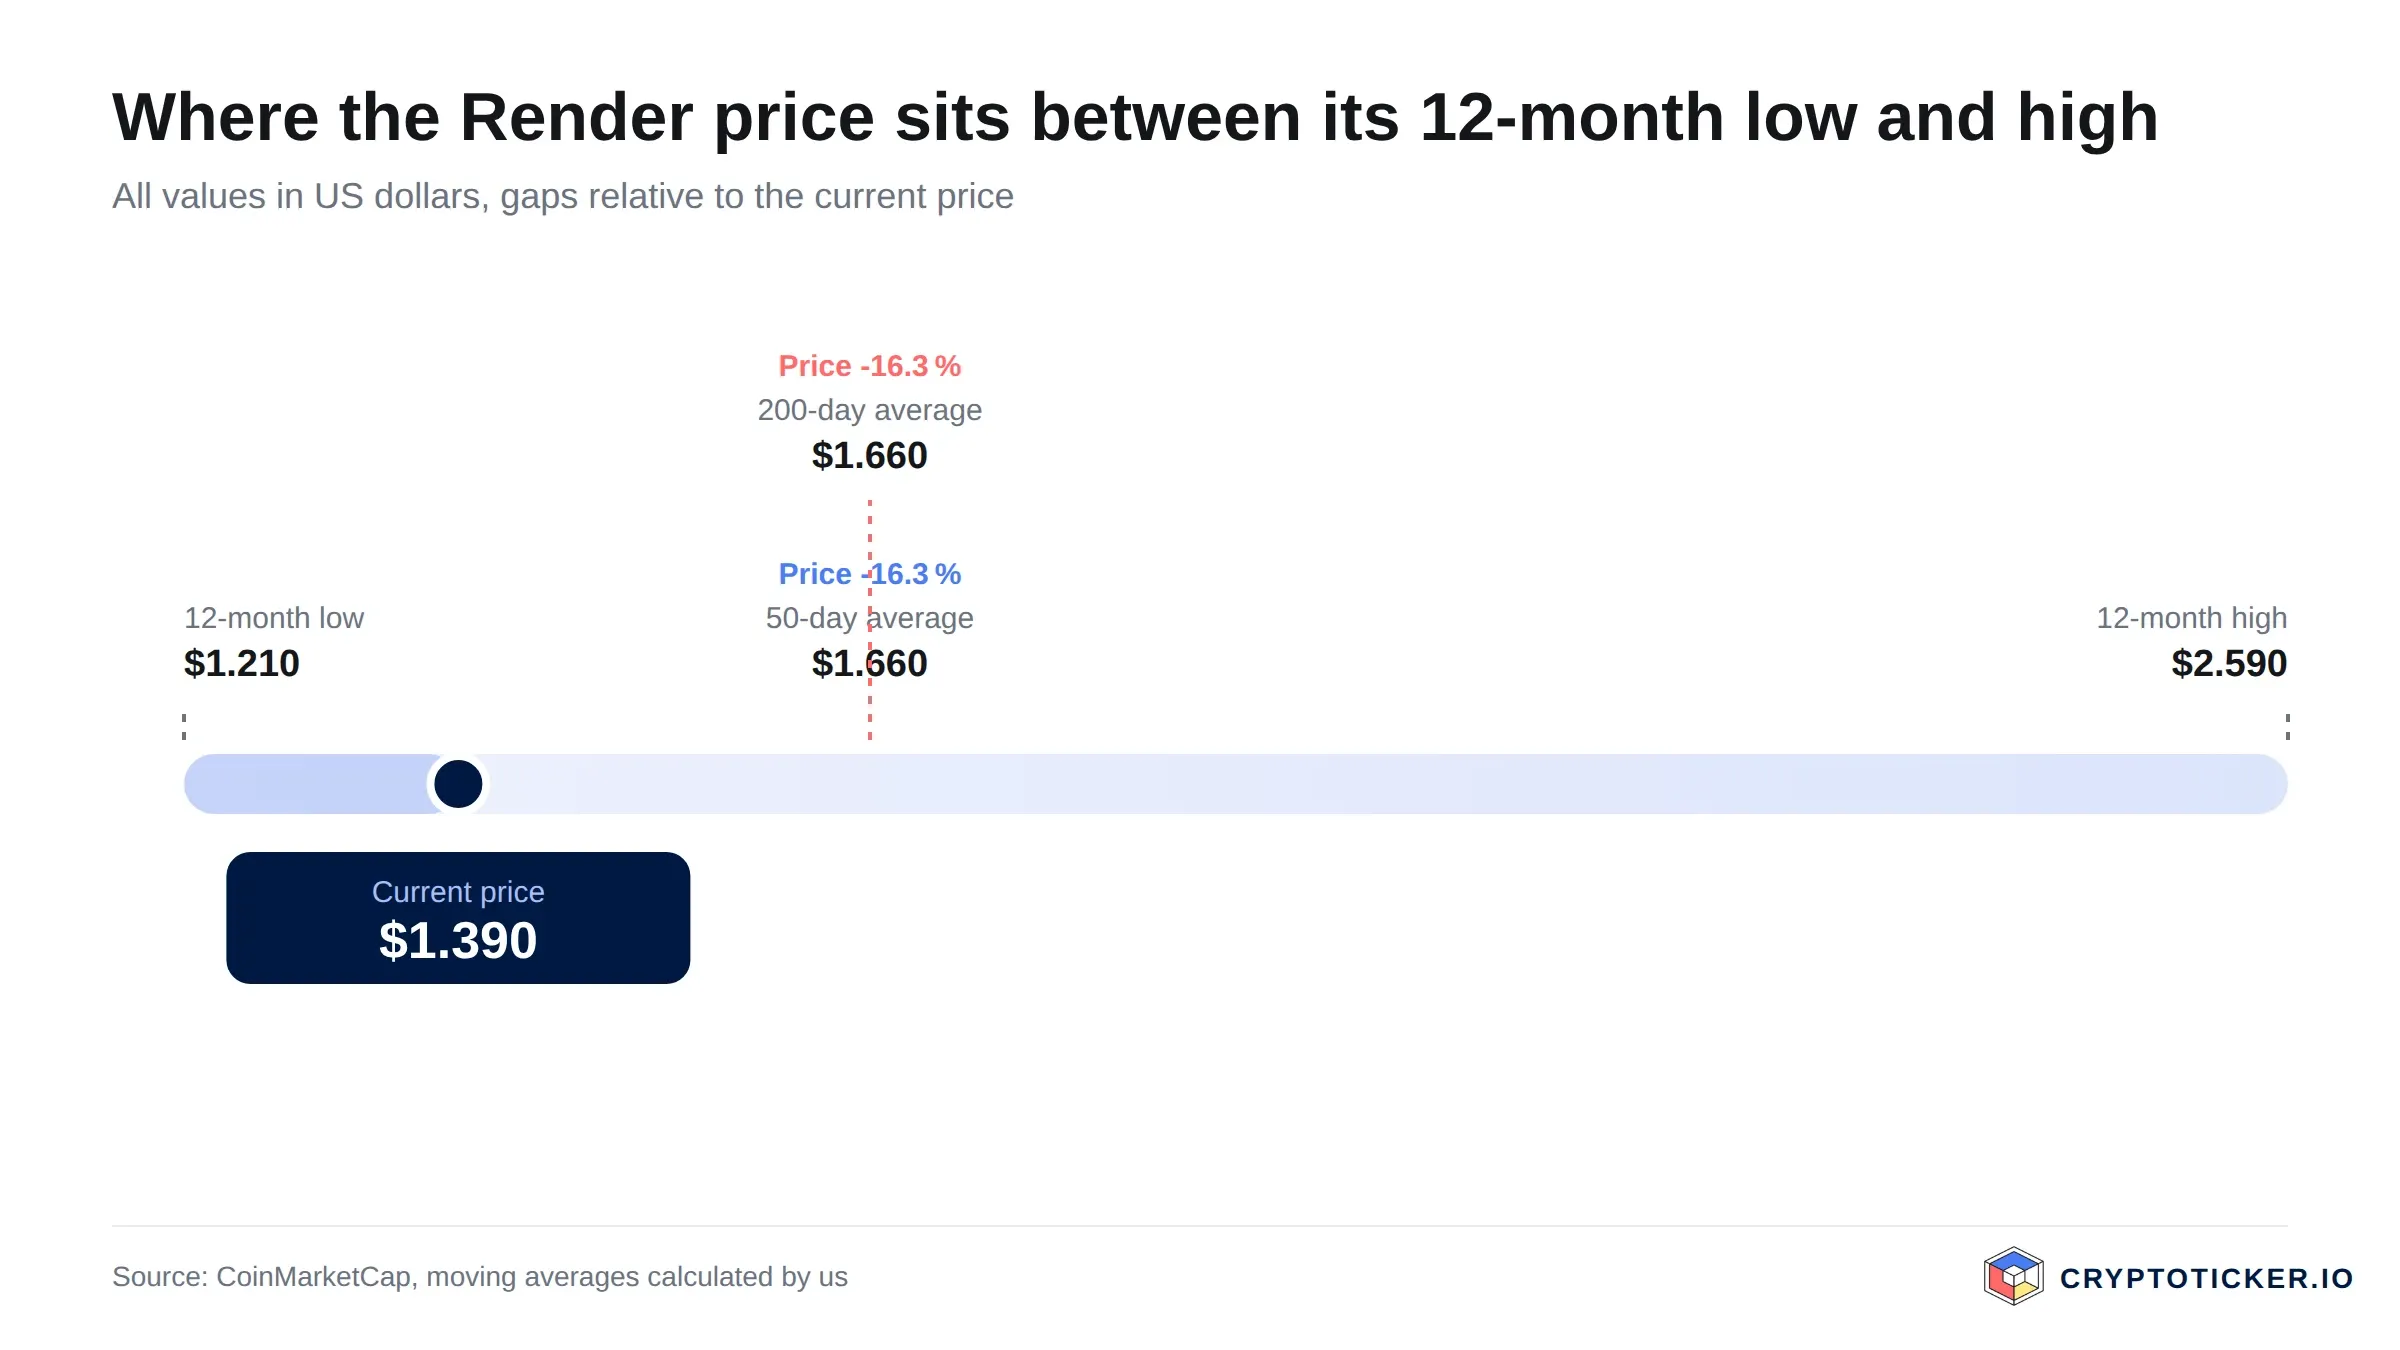
The Render price relative to its 12-month low, high and both moving averages
The breakout did not last. Render has closed below the 200-day line since 30 October, and on 14 November the 50-day average slipped back below the 200-day average. That death cross came just six weeks after the golden cross. The summer downtrend was therefore interrupted in October, not broken. A genuine break would only be confirmed if the price closed above $1.67 for several days and the October high of $2.14 came back within reach.
Render RSI and moving averages: what they mean for an entry
The 14-day RSI stands at 33. That is weak territory, but still above the threshold of 30 below which a market is commonly regarded as oversold. The last two lows show how differently such turning points can look. At the August low the RSI dropped to 28 before the price turned. At the September low, by contrast, it stood at 39, higher than today. An RSI of 33 therefore does not rule out a reversal, but it does not force one either.
The averages paint a clearer picture. Both sit above the price and both are sloping downwards. As long as that holds, they act as resistance: any recovery meets sellers between $1.66 and $1.67 who bought at higher prices in October and are waiting to get out without a loss. Buying against this structure is a bet on a trend reversal the chart does not yet show. Market sentiment fits the picture: CoinMarketCap's Fear and Greed Index stood at 13 on Monday, deep in extreme fear.
Render trading volume: what it reveals about demand
Over the past 24 hours RENDER tokens worth around $19.6 million changed hands. The 30-day average is $23.4 million, the 90-day average $35.6 million. Demand has cooled markedly. The busiest trading days of the quarter were 13 and 14 October, each above $100 million, when the price was trading around $2.00. Shortly afterwards it turned lower.
Heavy volume at the top and fading volume on the way down is a typical pattern after a rally driven mainly by short-term money. At the same time, the current decline lacks the high-volume sell-off that often marks the end of a correction. Render has not yet seen capitulation. Anyone waiting for a bottom should therefore watch for a day with turnover well above $50 million on which the price sets a new low and recovers the same day.
Structural factors for Render: burn-mint model, supply and regulation
Render runs a decentralised network for GPU computing power. Artists and studios use it to render 3D scenes, and increasingly to run AI workloads; owners of graphics cards supply the capacity. Since the move from Ethereum to the Solana blockchain, the token has been called RENDER rather than RNDR.
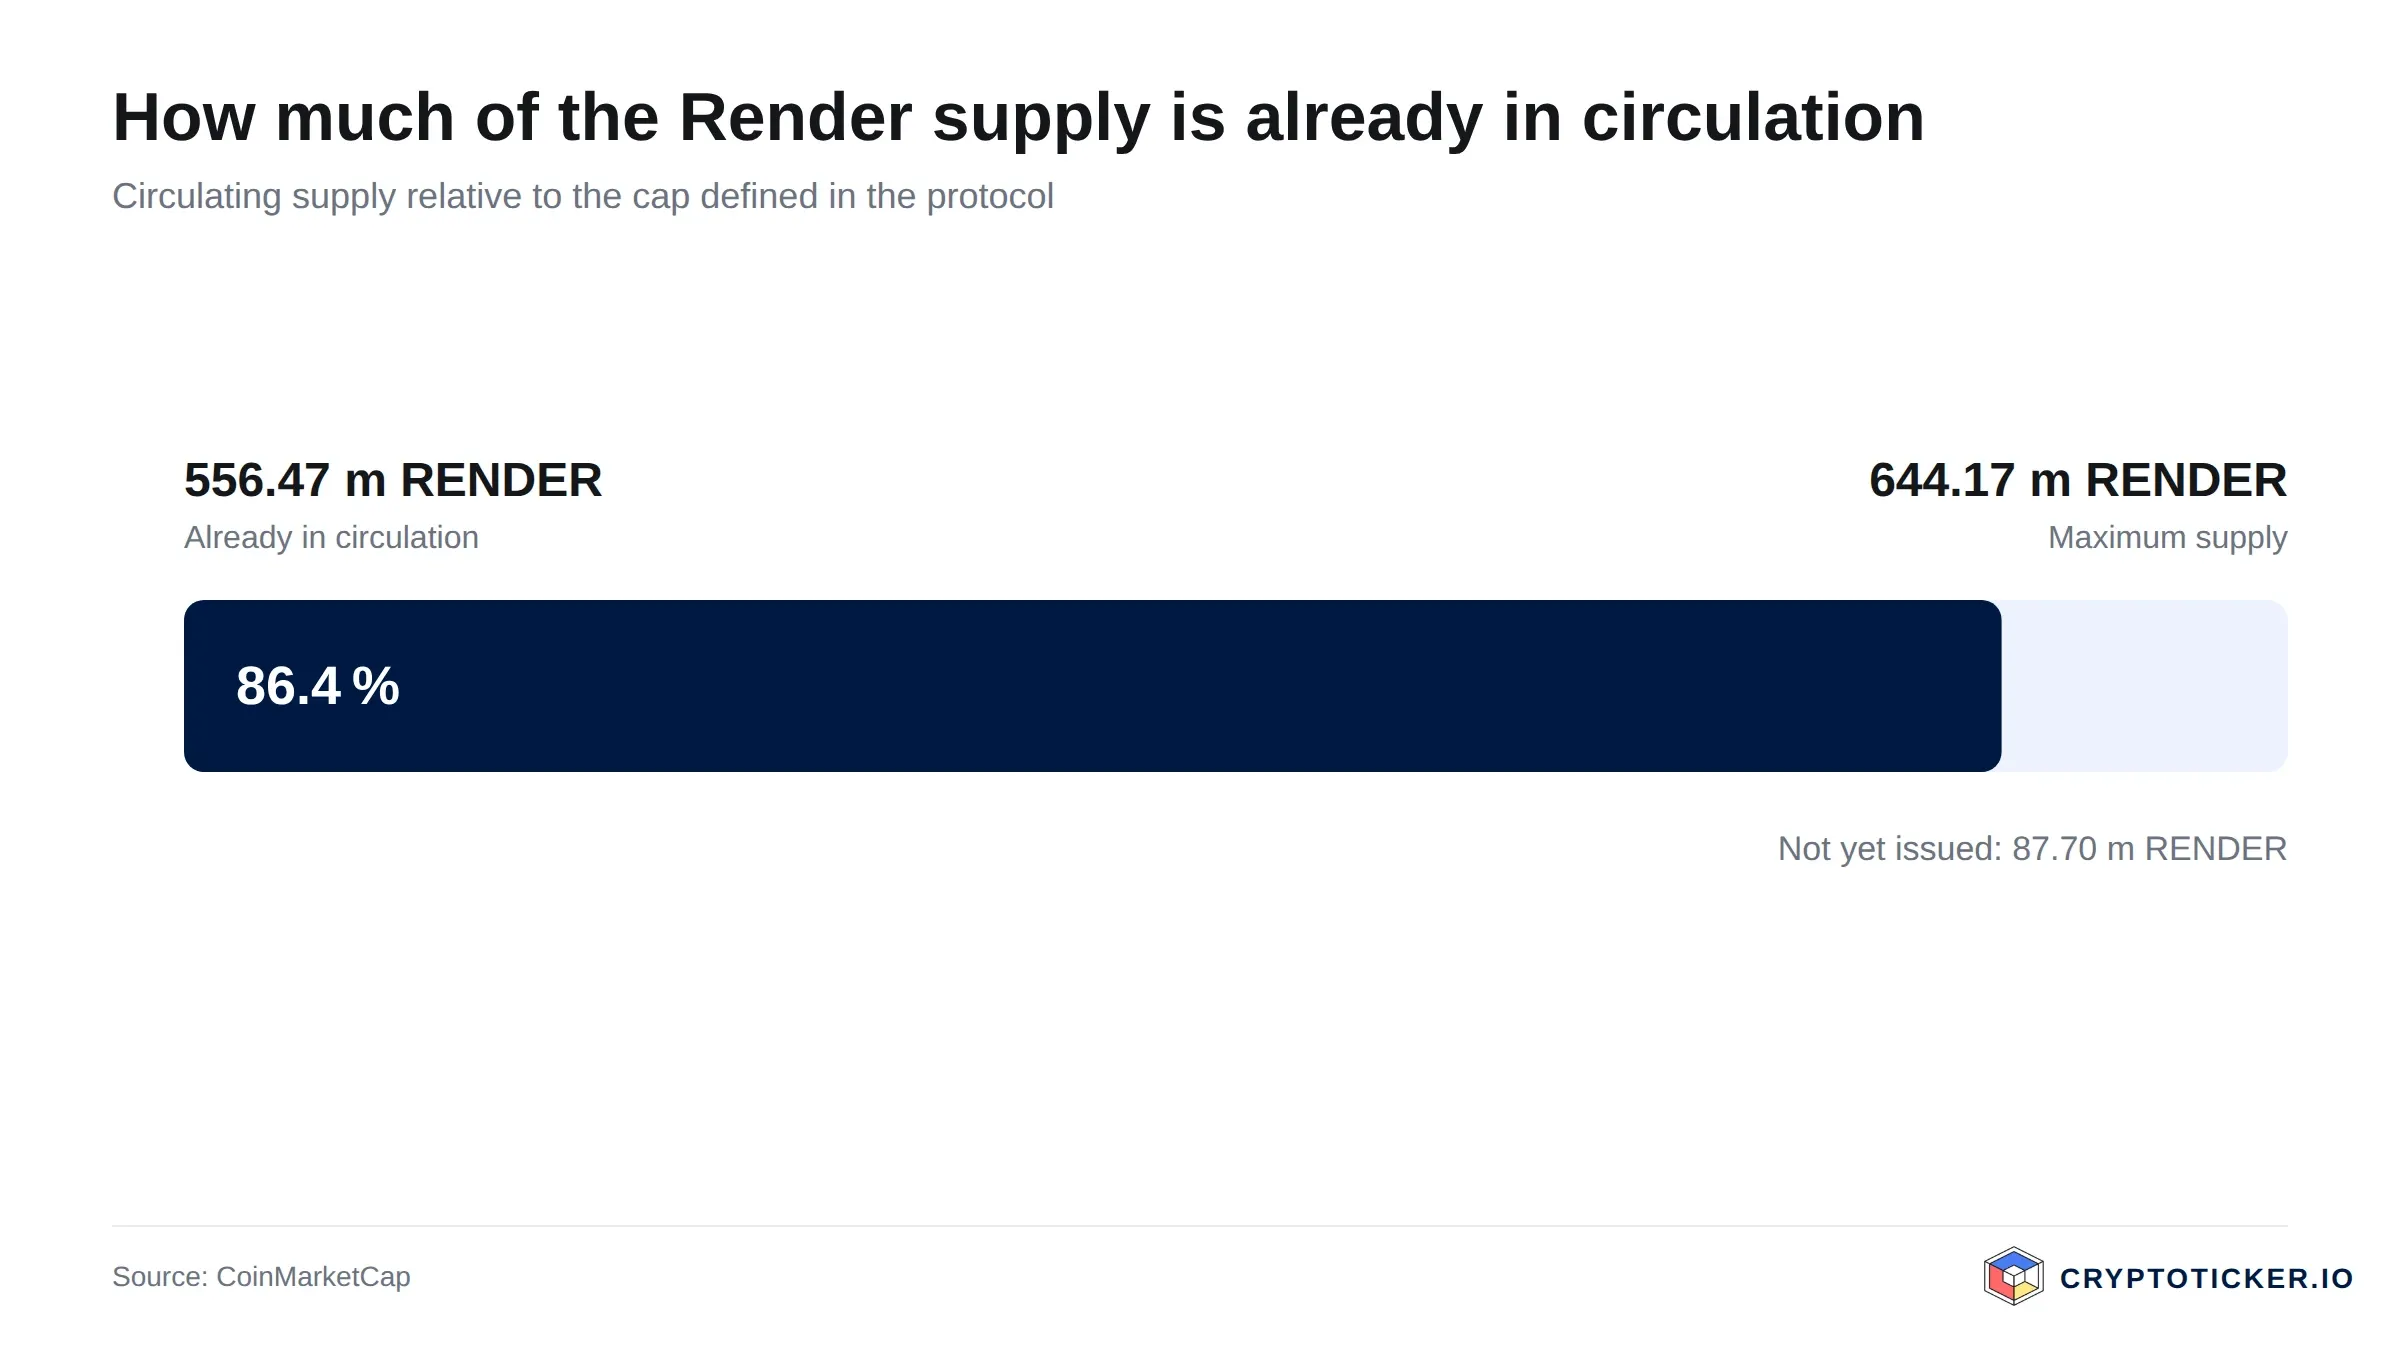
Render supply structure according to CoinMarketCap data
The core of the token economics is the burn-mint equilibrium. Jobs are priced in fiat currency and paid in RENDER, and the tokens used for payment are burned. At the same time the network issues new tokens to node operators according to a fixed, declining schedule, distributed in epochs of roughly a week. If usage rises, more tokens are burned than issued and supply shrinks. If demand stays weak, emissions dominate.
According to CoinMarketCap, 556.5 million RENDER are in circulation, against a maximum supply of 644.2 million. Around 86 percent of the maximum supply is therefore already tradable, which limits dilution from new tokens. On the regulatory side, RENDER falls under the EU's Markets in Crypto-Assets Regulation, MiCA. Providers selling the token to customers in the EU need authorisation as a crypto-asset service provider, listed in the register kept by ESMA.
What speaks for buying Render at current prices
- Close to strong support: Between the September low of $1.32 and the twelve-month low of $1.21 lie three levels at which the price has turned in the past twelve months. The downside risk to those levels is around 5 to 13 percent.
- Supply linked to usage: The burn-mint model ties the token to paid computing jobs. If demand for GPU power for rendering and AI grows, the volume of burned RENDER rises while emissions fall on schedule.
- Sentiment at rock bottom: A reading of 13 on the Fear and Greed Index shows a great deal of pessimism in the market. Contrarian buyers step in during phases like this, not after a rally like October's, when RENDER stood at $2.14.
What speaks against buying Render at current prices
- Death cross and falling trend: The price sits around 17 percent below the 200-day average, and the 50-day average dropped below it on 14 November. Both lines now act as resistance.
- Weak demand: Trading volume is roughly 45 percent below the 90-day average. Buyers willing to defend the price at this level are not yet visible in the volume.
- Dependence on AI sentiment: The September breakout was closely tied to the rotation into AI tokens, as our analysis of the Render rally and the rotation into AI tokens shows. If interest in this segment cools further, Render lacks a short-term driver of its own.
How to buy Render at current prices: costs, custody, providers
RENDER is available on the major European exchanges and brokers. Three points matter before you buy. First, costs: besides the trading fee there is the spread, the gap between buy and sell price, which can be noticeably wider for smaller coins than for Bitcoin. Second, regulation: a provider with MiCA authorisation offers a clear legal framework in the EU. Third, the blockchain: Render now lives on Solana. If you withdraw RENDER to your own wallet, you need a Solana-compatible address; old RNDR tokens on Ethereum can be swapped through the network's official upgrade portal.
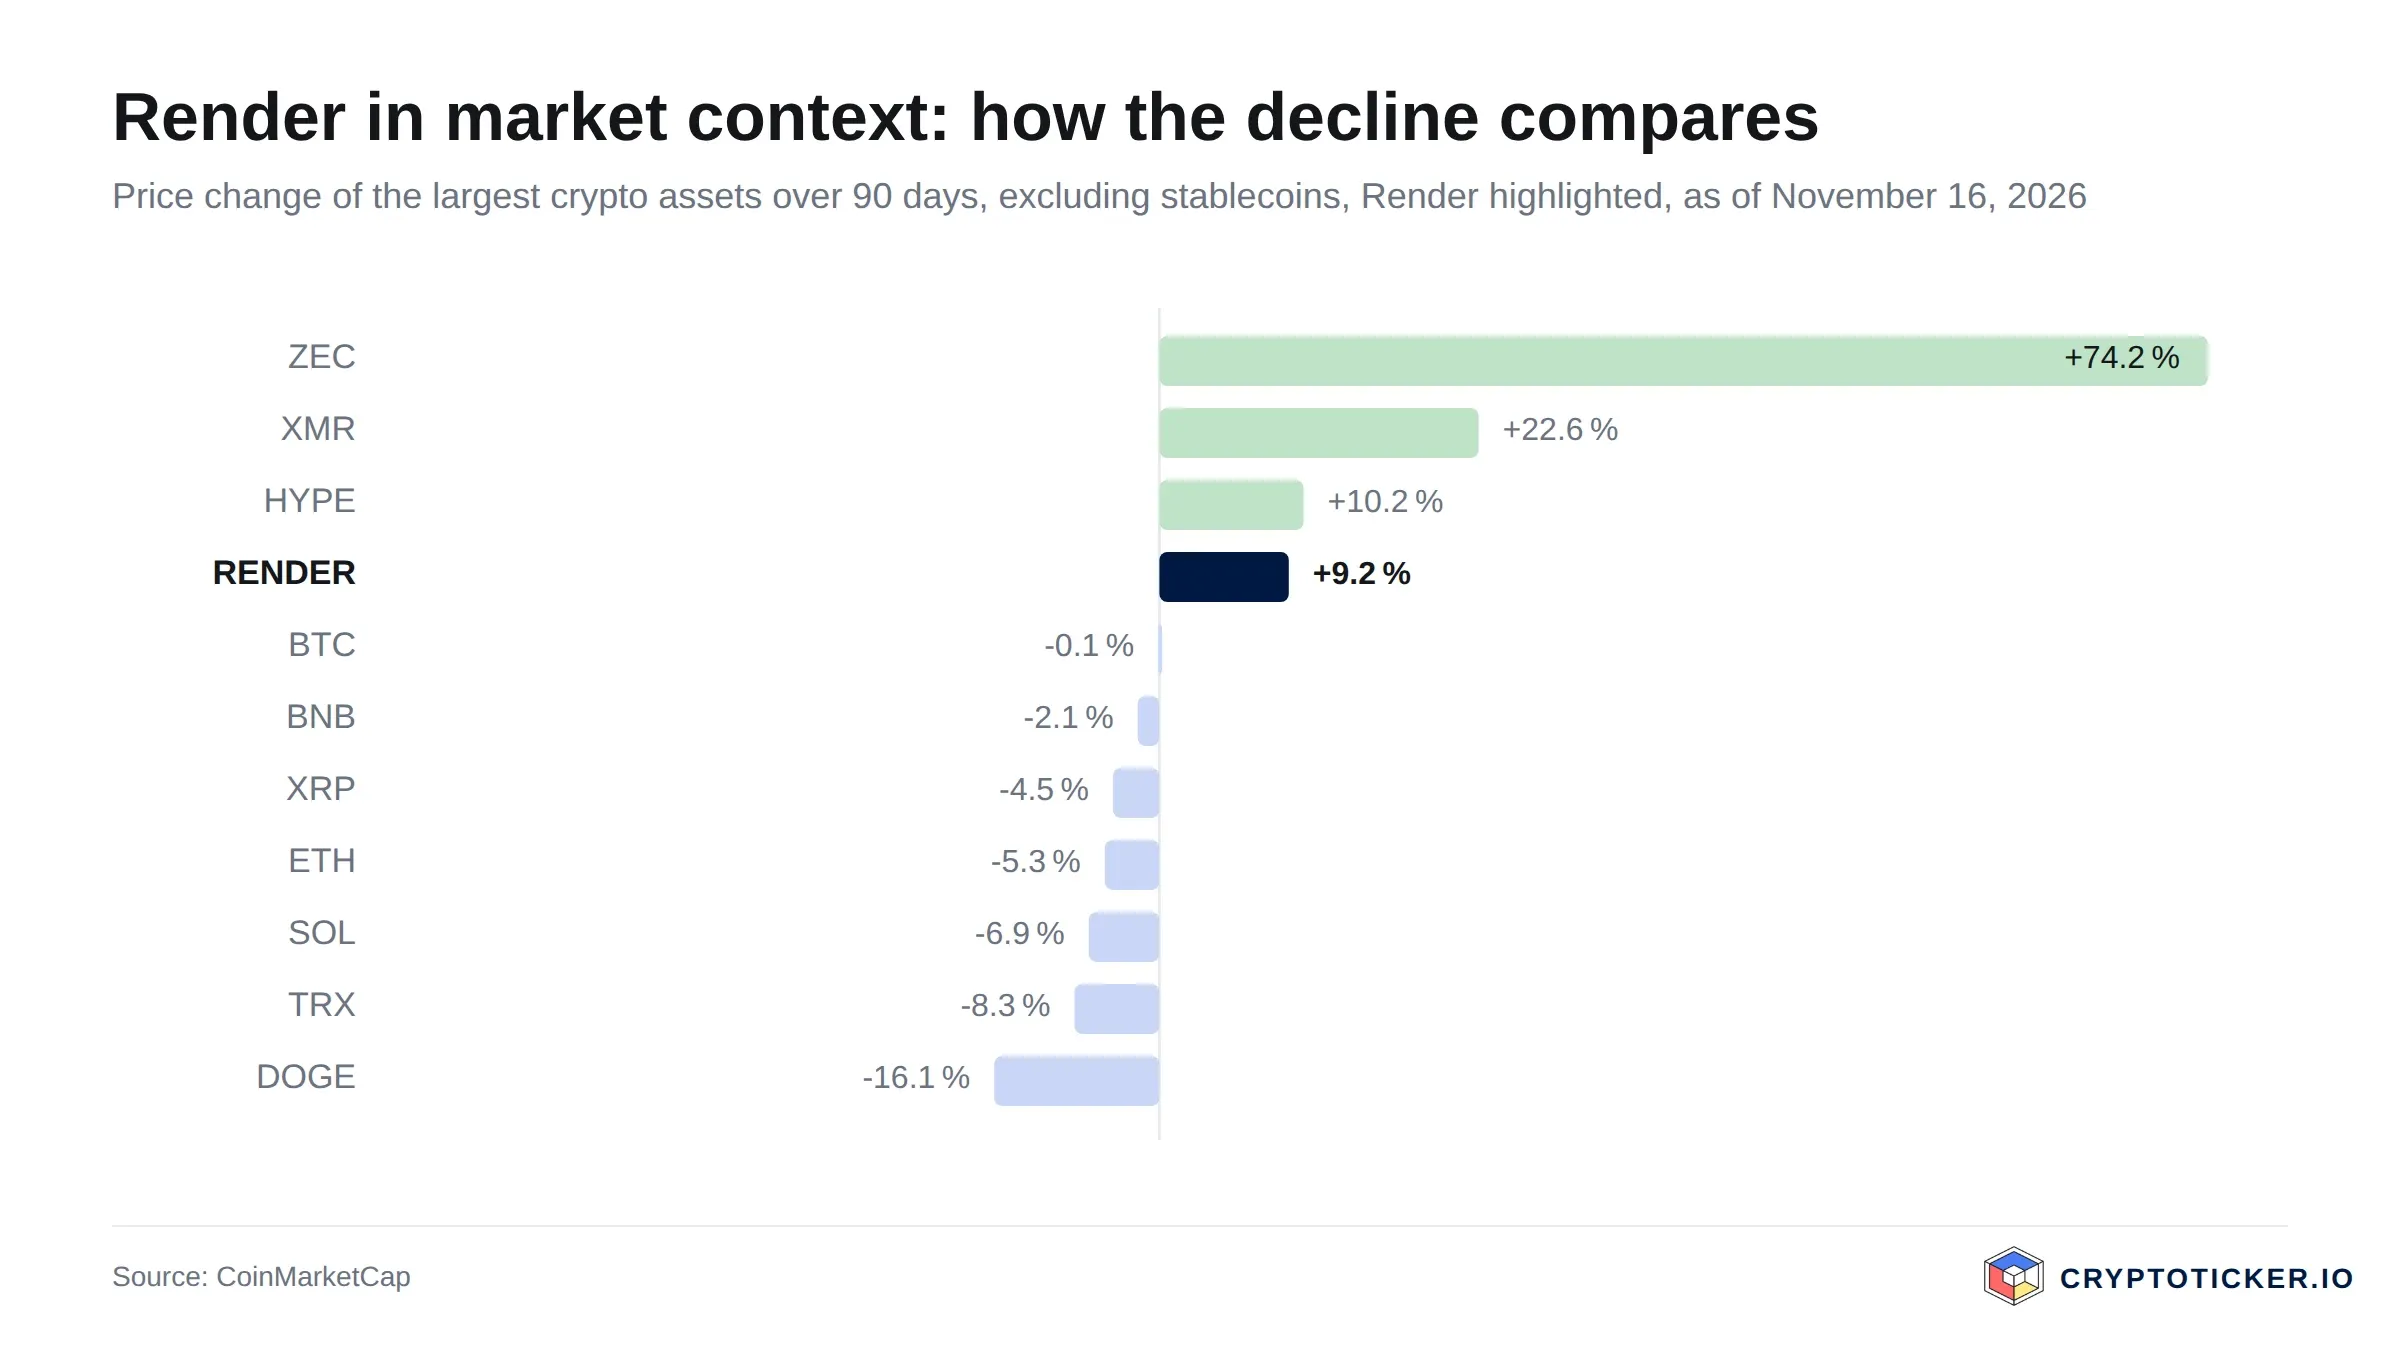
Render compared with the other large crypto assets over 90 days
Which providers offer savings plans, tight spreads or low fees is shown in our comparison of the best crypto brokers. For details on fees and custody at two widely used providers, see our Bitpanda review and our Kraken review. For longer holding periods, a hardware wallet with Solana support is a more robust form of custody than an exchange account.
So is Render a good buy at current prices?
In the short term the chart counsels patience. The price has only just fallen below its averages, the death cross is two days old, and volume shows no capitulation. A scenario in which RENDER first tests the September low of $1.32 or the August low of $1.25 is at least as plausible as a quick recovery. A daily close above $1.50 on rising volume, on the other hand, would clear the first hurdle. The band around $1.66 to $1.67 would remain the real test.
In the long term the answer depends on usage. Render combines a genuine need, GPU power for rendering and AI, with a token that is burned on every paid job. Whether that results in shrinking supply is shown by the ratio of burned tokens to new emissions, not by the price in any single month. The assumption of a sustainable floor would be invalidated if the price fell lastingly below the twelve-month low of $1.21. Long-term investors are better served spreading purchases over several weeks than betting on the one right day. For a view on the blockchain Render runs on, see our analysis of whether Solana is a good buy at current prices.
Buying Render: What to take away
- Choose a provider that supports RENDER on the Solana blockchain and holds a MiCA licence. Our comparison of regulated crypto exchanges offers a shortlist.
- Plan custody from the start: our hardware wallet comparison shows which devices store Solana tokens securely.
- Record your purchase date and price, because tax rules for crypto gains often depend on the holding period; in Germany, for example, gains are tax-free after one year. The programs in our crypto tax software comparison help keep track.
Disclosure: Some of the providers mentioned in this article work with us through affiliate programmes. This has no influence on the price analysis or the assessment of the chart; the price data comes from a public market data source and can be verified there.
(As of 16 November 2026. This article is not investment advice. Prices, fees and conditions change; check them with the provider before every purchase. Crypto assets are subject to high price volatility, and a total loss is possible.)