Key Takeaways 83% of Binance altcoins trade below their 200-day moving average. The 2021 bear market erased 75% of TOTAL3 over a year. Altcoin breadth between 60% and 90% below 200-DMA since
Key Takeaways- 83% of Binance altcoins trade below their 200-day moving average.
- The 2021 bear market erased 75% of TOTAL3 over a year.
- Altcoin breadth between 60% and 90% below 200-DMA since October 2025.
- Altcoins historically bottom weeks before Bitcoin does.
What TOTAL3 Is Telling Us
TOTAL3 is the TradingView ticker that tracks the combined market capitalization of every cryptocurrency except Bitcoin and Ethereum. It functions as the cleanest single-number read on altcoin market health because it strips out the two assets most likely to attract institutional safe-haven flows during risk-off periods, leaving only the performance of the broader speculative layer.
Analyzing the weekly TOTAL3 chart, the current reading of $660 billion represents a 44.6% contraction from the October 2025 cycle peak, with $532.19 billion in market value erased over 238 days. The RSI on the weekly timeframe sits at 34.66 with the signal line at 38.43, approaching but not yet at the oversold readings that accompanied the 2022-2023 bear market floor.
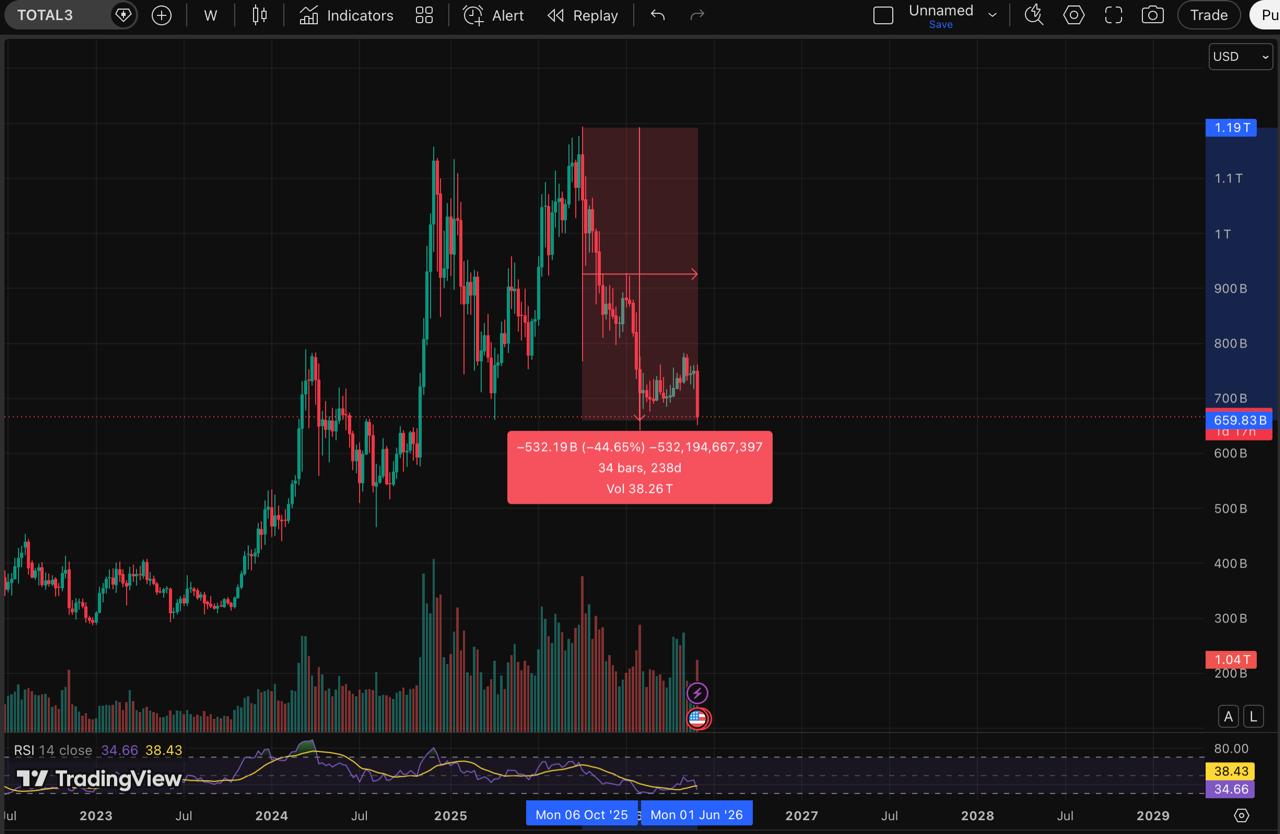
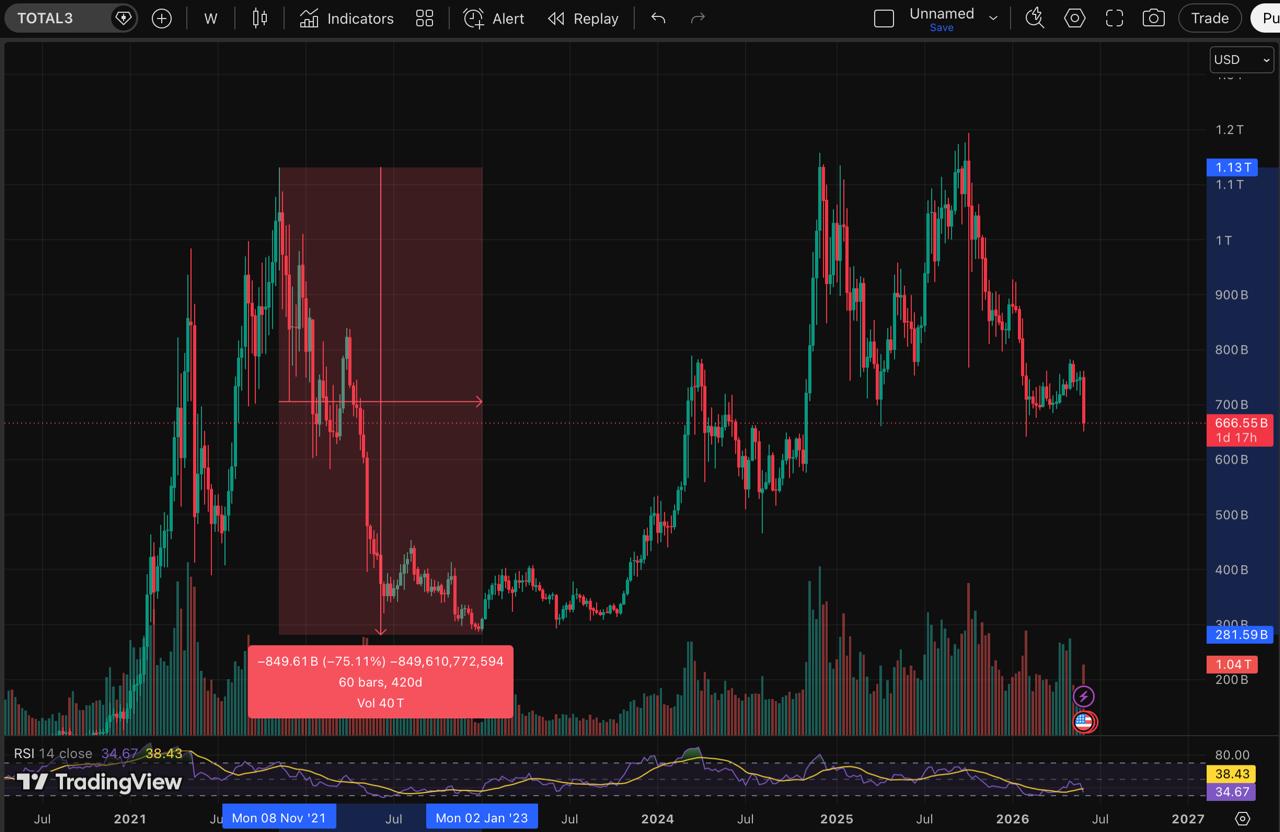
For context, the 2021-2023 bear market wiped 75.11% from TOTAL3 over a little more than a year before the recovery began. The current drawdown, at 44.65%, is tracking at roughly half that severity. Whether the compression reflects a structurally healthier altcoin market or simply an incomplete correction remains the central unresolved question.
83% of Altcoins Below Their 200-DMA
CryptoQuant analyst Darkfost wrotethat nearly 83% of assets listed on Binance are currently trading below their 200-day moving average, a key technical threshold that separates assets in long-term uptrends from those in sustained downtrends. The 200-DMA is widely used by institutional participants as a filter for structural market health – when the majority of assets in a category trade below it for extended periods, it signals a regime of broad-based underperformance rather than isolated weakness.
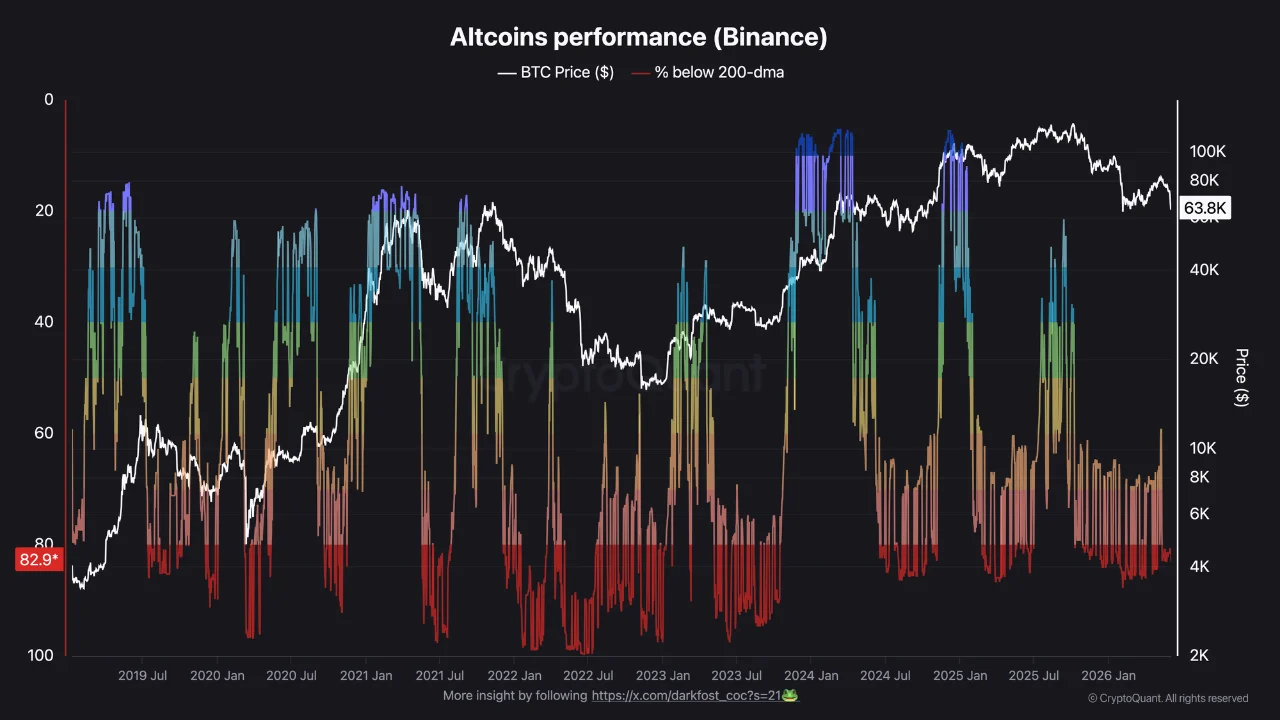
What makes the current reading structurally significant is not the 83% figure itself but its persistence. Darkfost confirmed that since October 2025, the percentage of altcoins below their 200-DMA has ranged between 60% and 90% without returning to healthier breadth levels. “This ranks among the lowest readings observed during the current cycle,” the analyst wrote. “More importantly, however, is the persistence of this weakness.”
The last time altcoin breadth expanded strongly above this range was in March and December 2024, when nearly 90% of altcoins traded above their 200-DMA. Darkfost noted that such breadth expansion had not been seen since 2017, contextualizing just how unusual that period was and how far the current environment sits from it.
READ MORE:
 Ethereum Inflows Hit 4-Month High as Price Slips Below $1.6K
The Altcoin Season Index
The Altcoin Season Index, published by CoinMarketCap, tracks the rolling 90-day price performance of the top 100 cryptocurrencies by market cap, excluding stablecoins and wrapped tokens, and measures what percentage of them have outperformed Bitcoin over that window. The methodology is straightforward: if 75% or more of the top 100 outperform Bitcoin over 90 days, the index classifies the period as Altcoin Season. If 25% or fewer outperform Bitcoin, it classifies as Bitcoin Season. The index scales from 1 to 100 and refreshes daily.
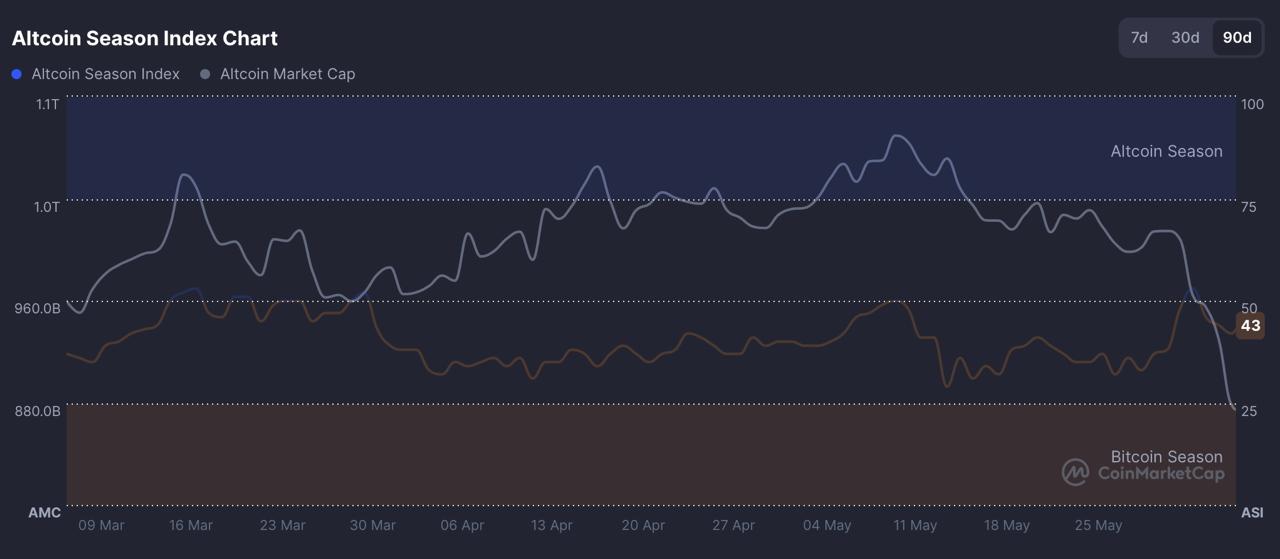
The current reading is 43. That places the market below the 50 neutral threshold and well outside Altcoin Season territory. The 90-day chart shows the index spent much of March through May 2026 oscillating between 50 and 75, briefly touching Altcoin Season territory before collapsing sharply in late May as the broader market selloff accelerated. The altcoin market cap peaked alongside the index highs and has been in sustained contraction since.
Altcoins Bottom Before Bitcoin
Joao Wedson, Founder and CEO of Alphractal and a verified author at both CryptoQuant and CoinMarketCap, wrote on Xthat the current altcoin weakness may be setting up a historically recurring sequence. “Altcoins will likely bottom first in this cycle, before Bitcoin,” Wedson wrote. “Historically, this has been happening since 2017. Altcoin bear markets usually end a few weeks before Bitcoin’s bear market does. This applies to ETH, SOL, ADA, DOGE, and many others.”
The observation carries structural logic. Altcoins, being more speculative and less liquid than Bitcoin, tend to front-run Bitcoin’s directional moves in both directions. They peak before Bitcoin peaks, bottom before Bitcoin bottoms, and recover before Bitcoin’s recovery becomes visible to the broader market. If Wedson’s historical framing holds, the current 83% below 200-DMA reading and the Altcoin Season Index at 43 could be closer to a floor than they appear.
The counterargument is equally straightforward: the TOTAL3 RSI at 34.66 has not yet reached the extreme oversold readings that marked the 2022-2023 confirmed bottom, and the 44.65% drawdown remains shallower than any completed prior cycle correction. Both conditions suggest the possibility that the current readings represent an intermediate phase rather than a terminal one.
What Would Confirm a Bottom
Darkfost framed the current environment with a historically grounded observation: “The most interesting opportunities often emerge during periods of extreme pessimism rather than when nearly 90% of altcoins are trading above their 200-DMA.”
Three signals would collectively indicate a structural inflection: the percentage of altcoins below their 200-DMA contracting from 83%, the Altcoin Season Index reclaiming and holding above 50, and TOTAL3 stabilizing above $660 billion with a higher low on the weekly chart before the RSI confirms an upturn from 34.66.
The data does not confirm a bottom, but the altcoin market is entering territory where prior cycles have found one. A 44.65% TOTAL3 drawdown over 238 days, 83% of altcoins below their 200-DMA, and the Altcoin Season Index at 43 describe late-stage capitulation rather than early-stage decline. Wedson’s framing, that altcoins bottom weeks before Bitcoin, a pattern consistent since 2017, places the potential floor closer than current price action implies. Whether it holds at $660 billion or requires a deeper flush to levels the weekly RSI at 34.66 has not yet confirmed is the open question. What the data does not support is the conclusion that the bottom is already in.
The information provided in this article is for educational purposes only and does not constitute financial, investment, or trading advice. Coindoo.com does not endorse or recommend any specific investment strategy or cryptocurrency. Always conduct your own research and consult with a licensed financial advisor before making any investment decisions.
The post Is the Altcoin Bottom Near? TOTAL3 Drops 44% Over 238 Days appeared first on Coindoo.