Did ETHFI find a floor at $0.4167, or is this a quick bounce in a downtrend? The ETHFI price prediction turns on a retest at 07:10 UTC on Nov 22, 2026. Price trades near $0.4809, up 9%, and s
Did ETHFI find a floor at $0.4167, or is this a quick bounce in a downtrend?
The ETHFI price prediction turns on a retest at 07:10 UTC on Nov 22, 2026. Price trades near $0.4809, up 9%, and sellers turned it back at $0.53 on the 19th.
Earlier work onether.fi support levels helps frame where buyers stepped in before.
ETHFI Price Data Snapshot at 07:10 UTC
ETHFI price today is $0.4795, up 9.08% in 24 hours, based onCoinMarketCap data.
Market cap is $462.9M. Fully diluted valuation (FDV, the value if all 1B tokens were live) is $479.5M.
The 24h range runs from $0.422 to $0.4877, and trading volume is $33.92M.
The all-time high is $8.57 from Mar 28, 2024, so the price sits 94.42% below it. Ether.fi is a liquid staking protocol on Ethereum.
ETHFI Price Prediction Starts With the 4H Chart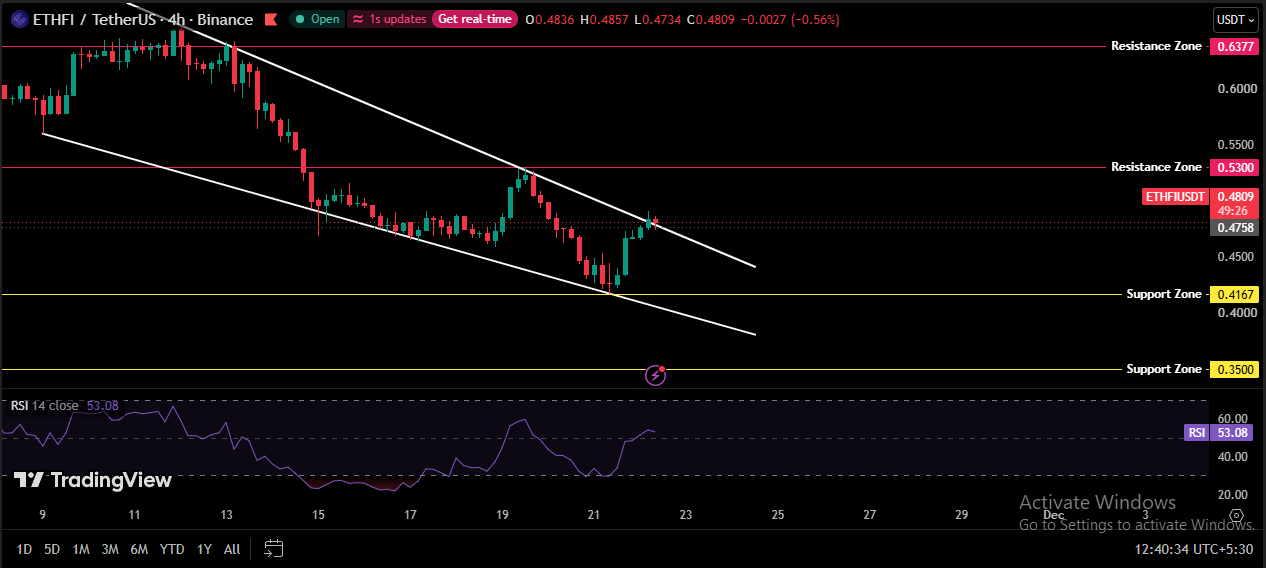
Price sat near $0.60 on the 9th of November and ran to a high around $0.64 by the 11th of November. Resistance, a level that has capped the price before, sits at $0.6377.
Sellers took over near the 13th of November. By the 15th of November, ETHFI traded around $0.47 inside a falling wedge, a pair of sloping lines that trap price.
On the 19th of November, the price spiked to about $0.53 and met the upper trendline, the line joining lower highs.
And the drop was quick. ETHFI tagged $0.4167 on the 21st of November, where the lower trendline meets support, a level where buyers have stepped in before.
Buyers showed up. The latest 4H candle, which covers four hours, spans $0.4734 to $0.4857, and the price now trades at $0.4809 against the upper trendline. That's two tests of the same line, the first on the 19th and this one now.
A breakout needs a 4H candle that trades and holds above the line. That hasn't happened, so this ETHFI technical analysis stays neutral for now.
An earlierascending triangle breakout in ETHFI had a different structure.
RSI and Wedge Retest
RSI, the relative strength index, scores buying strength from 0 to 100, and a reading under 30 means oversold. It fell near 30 on the 21st of November at the $0.4167 low.
It's now 53.08, dead centre.
A climb out of oversold sounds bullish. RSI topped above 60, and the price still got rejected at $0.53.
The falling wedge stays intact until the price holds above the upper trendline near $0.4758.
Futures Data Behind the Bounce
Futures drove this move. Open interest, the total value of open contracts, rose 12.66% to $74.67M onCoinGlass futures data.
Futures volume reached $86.74M. Spot volume on that feed was $6.75M, a 12.8x gap, while CoinMarketCap counts $33.92M.
Funding rate: the fee for long and short swaps every 8 hours. Just 0.0020%, or about 2.2% annualised.
Perp basis, the gap between perpetual futures and spot price, is -0.104%. A small discount.
So who's buying?
Spot net flow of -$248.0K. Negative, so buyers aren't piling into the spot.
But a bounce built on 12.8x futures volume is thin.
Exchange Flow and BingX Volume
Binance leads open interest at $23.29M, then Bybit at $10.70M and Gate at $9.67M.
BingX is the odd one. Trading volume there is $20.59M. Up 81.2% in a day.
And net flow on BingX is -$18.77M, which is 91.1% of its volume. Money left.
That's a single venue doing the work, nearly a quarter of all futures volume, not broad demand.
Liquidations and Crowd Positioning
Shorts got hit first. Liquidations, the forced exits of leveraged trades, total $52.81K over 24 hours as of 07:10 UTC.
Shorts lost $30.47K, or 58%. The last hour saw $326.29.
The long/short ratio, which compares long and short accounts, is 1.0115 on Binance and 0.9309 on Gate. Split.
Fear and Greed sits at 10. Extreme Fear.
Supply and Holders Check
Circulating supply is 965.35M of 1B ETHFI, leaving 34.65M still to enter the market.
An Ether.fi price prediction that skips thin spot volume misses the main risk.
Holders total 131.79K on CoinMarketCap and 93,265 onEtherscan holder data.
But supply isn't the weak spot right now. Spot volume is.
ETHFI Price Prediction Scenarios and Key Levels
ETHFI support and resistance sit at $0.4167 and $0.3500 below and at $0.53 and $0.6377 above.
Scenario
Trigger
Target
Invalidation
Liquidity Condition
Bull
4H hold above trendline and $0.53
$0.6377
Back under $0.4758
Spot volume above $6.75M
Base
Range inside wedge
$0.4167 to $0.53
Break either side
Futures-led, thin spot
Bear
4H loss of $0.4167
$0.3500
Reclaim of $0.4758
Net outflows, OI unwinds
Base case first. Price chops between $0.4167 and $0.53, the most probable path.
And bulls get a shot only above $0.53 with spot volume over $6.75M. That opens at $0.6377, the next ETHFI price target.
Bears win on a 4H loss of $0.4167. The next stop is $0.3500. More coin setups sit inlatest altcoin setups.
What Would Change the ETHFI Price Forecast
The ETHFI price forecast shifts on levels and volume, not on a single green day.
A 4H hold above $0.53 with rising spot volume flips the bias to bullish. But a 4H loss of $0.4167 flips it bearish.
Fresh spot listings would help most. Updates sit incrypto exchange listing updates.
ETHFI Bounce Verdict
The 9% bounce is a retest, not a reversal, until $0.53 trades and holds on the 4H chart.
Between $0.4167 and $0.53, the setup stays neutral. Above is bullish; below is bearish.
Spot buyers haven't shown up yet.
Disclaimer: This article is for information only and isn't financial advice. Crypto prices are volatile, and levels can fail. Readers should do their own research before trading.