Venice Token trades at 24.56 dollars. That is 23.1 per cent below the twelve-month high of 31.92 dollars, which the VVV price set on 22 September, and it is many times the twelve-month low of
Venice Token trades at 24.56 dollars. That is 23.1 per cent below the twelve-month high of 31.92 dollars, which the VVV price set on 22 September, and it is many times the twelve-month low of 0.95 dollars from December 2025. Anyone buying today buys neither at the peak nor in a sell-off, but in the middle of a sideways zone. That is what makes the decision hard.
All averages, distances and trend markers in this article were calculated by cryptoticker.io itself, as of 27 October 2026, from the daily closing prices of the past twelve months at CoinMarketCap. The longer-term scenarios are set out separately in our Venice Token price prediction.
Venice Token price analysis: where the VVV price stands
The Venice Token price stands at 24.56 dollars. Beyond that figure, three marks matter. The 50-day average sits at 23.88 dollars, so the price trades 2.8 per cent above it. The 200-day average lies at 16.70 dollars, and the distance to it is 47.0 per cent. The twelve-month high of 31.92 dollars is 23.1 per cent away, while the twelve-month low of 0.95 dollars lies so far back that it now shows only the scale of the move: a year ago the project came out of nowhere.
Over the past week, trading took place between roughly 22.30 and 26.90 dollars, a span of about 20 per cent. The lower edge of that zone almost exactly matches the 50-day average, and that is why this mark currently carries the most weight. If the price drops below it and stays there, it has no second support until the 200-day average, which is around a third lower.
The time frames contradict each other. Over 30 days the price is down 18.9 per cent, over 90 days it is up 89.1 per cent, and over twelve months it is up roughly 1,290 per cent. September delivered the record, October delivered the correction. For a buying decision, only one of them is useful: the question of whether the October move was a pause in an upward trend or the start of its reversal.
Is the Venice Token downtrend broken or only interrupted?
Since the high on 22 September, the chart has produced lower highs. The weakest closing price of October was 22.31 dollars on 18 October, after which the price recovered to 26.90 dollars within four days and has since given back part of that gain. This is the pattern of a correction inside a larger upward movement rather than a trend reversal, and the reason is the structure beneath it: the lows of October lie clearly above the lows of August.
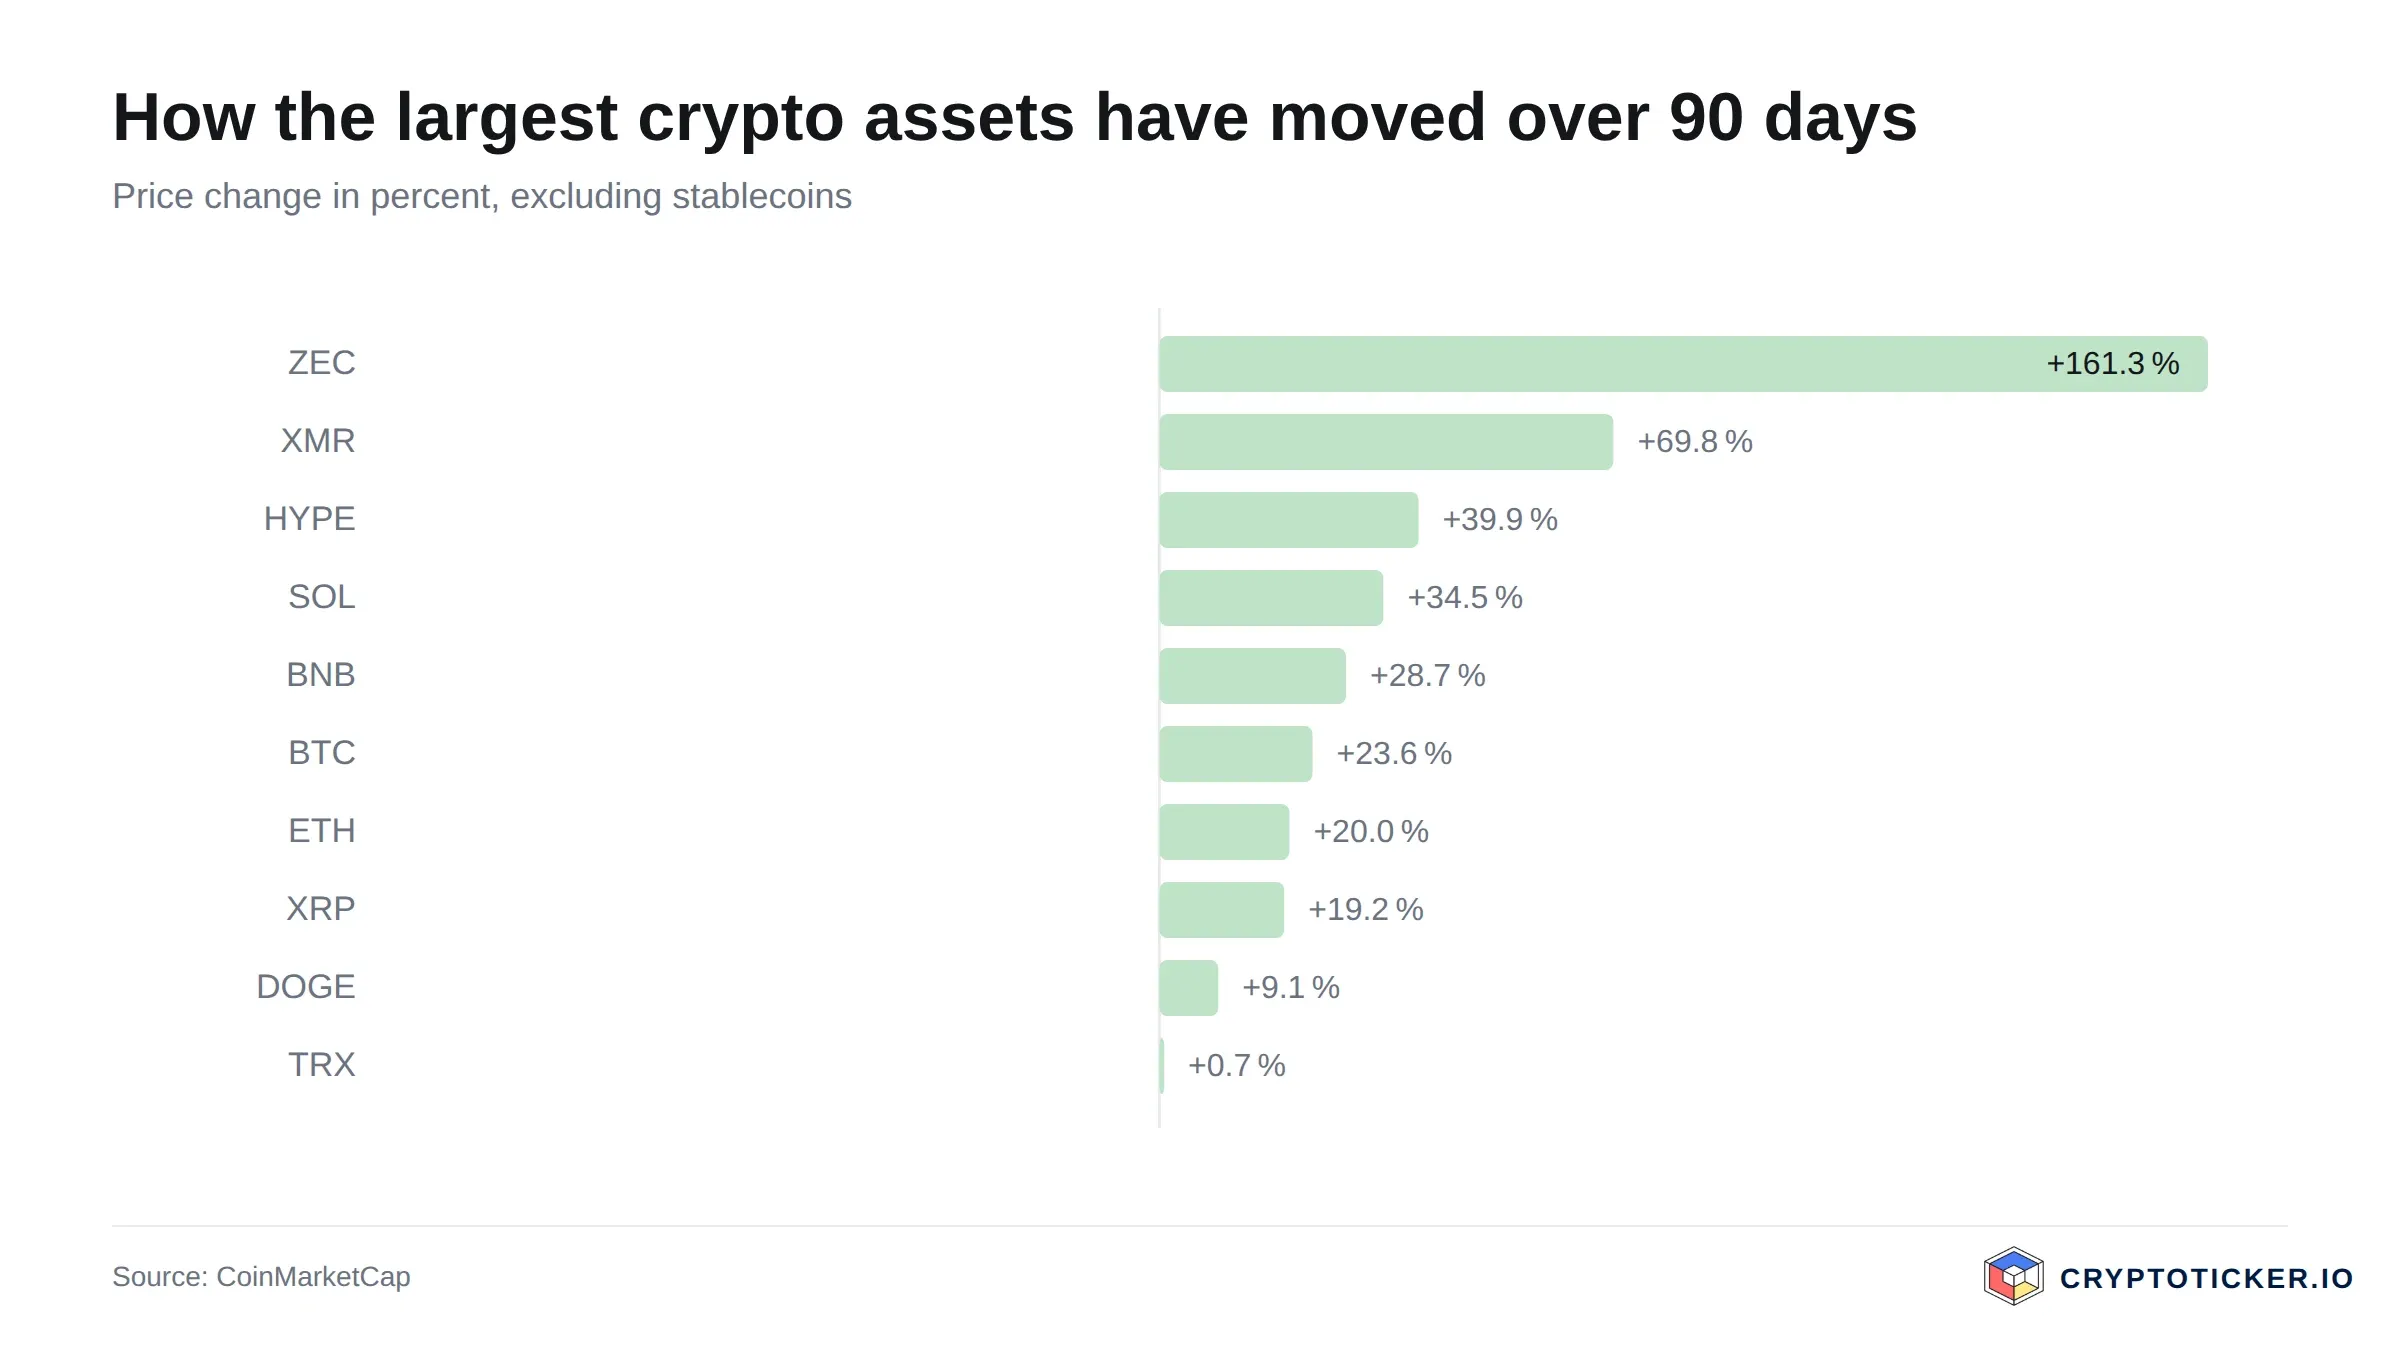
The largest crypto assets compared over 90 days, according to CoinMarketCap data
What has not happened is the decisive break. A trend counts as broken once the price falls below its medium-term average and confirms that break with further closing prices. Venice Token has come close to the 50-day average twice in October and has turned upwards both times. As long as that holds, the correction is interrupted, not finished.
The second line is further down. Between the current price and the 200-day average at 16.70 dollars lies around 32 per cent of empty space, with no notable trading zone from the past twelve months inside it. That is the uncomfortable part of this chart: it is stable above 23.88 dollars and has little to hold on to below it.
What RSI and moving averages mean for a Venice Token entry
The 14-day relative strength index stands at 51. That is the middle of the scale. Readings below 30 are considered oversold and are often used as entry signals, readings above 70 as overbought. At 51, Venice Token offers neither. The market is undecided, and anyone waiting for a technical bargain signal is not getting one here.
The two averages tell a clearer story. The price trades above the 50-day average at 23.88 dollars and far above the 200-day average at 16.70 dollars, and the shorter average lies above the longer one. In classical chart analysis, that is an intact upward structure. It says nothing about the next few weeks, but it does separate this case from a coin that has already fallen through all of its averages.
The broader market mood fits the neutral picture. The Fear and Greed Index for the crypto market stands at 43 points, which is the lower end of the neutral zone. Neither panic nor euphoria is priced in at the moment, and that tends to favour staggered entries over a single large one.
What trading volume reveals about demand for Venice Token
Venice Token turned over 32.9 million dollars in the past 24 hours, 27.9 per cent more than in the previous day. Measured against the market capitalisation of 1.20 billion dollars, that is a daily turnover of roughly 2.7 per cent. For a token outside the top 50, that is a workable figure: positions of a few thousand dollars can be built and closed without moving the price.
The comparison over time says more than the daily figure. Over the past 30 days, average daily turnover was around 39.5 million dollars, and over 90 days around 39.3 million. Current volume therefore runs below both averages. The price is consolidating on thinner trading, which is the normal picture after a sharp rise: sellers are no longer pushing, and buyers are not yet insisting.
For a buying decision, that cuts both ways. Falling volume during a correction argues against a disorderly exit, because a wave of liquidations would look different. It also means the recovery from 22.31 dollars rests on comparatively little capital, and a move carried by thin volume is easier to undo than one carried by heavy turnover.
Which structural factors speak for Venice Token
Venice Token is not a pure market instrument. VVV is the access token of a privacy-focused AI platform, and staking it grants a daily inference quota on that platform, as the project documents on its own token page. Demand therefore comes partly from users who want computing capacity, not only from traders expecting a higher price. That is a different demand base from a token whose only use is trading.
The supply side is less comfortable. Around 48.93 million VVV circulate out of a total supply of 81.19 million, which means roughly 60 per cent of the tokens are in the market. There is no hard maximum supply, so emission continues, and this dilution is the main structural argument against the token. Anyone buying should expect new supply to keep arriving rather than a fixed ceiling as in Bitcoin.
The technical base is the Ethereum layer-2 network Base, which keeps transfer costs low and makes the token accessible through established infrastructure. At rank 55 by market capitalisation, Venice Token sits in a segment where liquidity is sufficient but index demand is largely absent. Price formation here follows the project and the AI sector, not broad allocation flows.
What speaks for buying Venice Token at the current price
Three points carry weight in favour.
First, the long-term trend is intact. At 47.0 per cent above the 200-day average, the price has a wide buffer, and the upward structure has not been damaged by the October correction. Buyers are not catching a falling knife here.
Second, the entry is 23.1 per cent below the high instead of at it. Anyone convinced by the project pays noticeably less today than in late September, and the 50-day average at 23.88 dollars provides a concrete reference point just below the current price against which the decision can later be measured.
Third, demand is tied to usage. The staking quota on the platform creates a reason to hold the token that is independent of price expectations, and that reason also exists in a weak market. Tokens without such a link depend entirely on sentiment.
What speaks against buying Venice Token at the current price
Three points carry weight against.
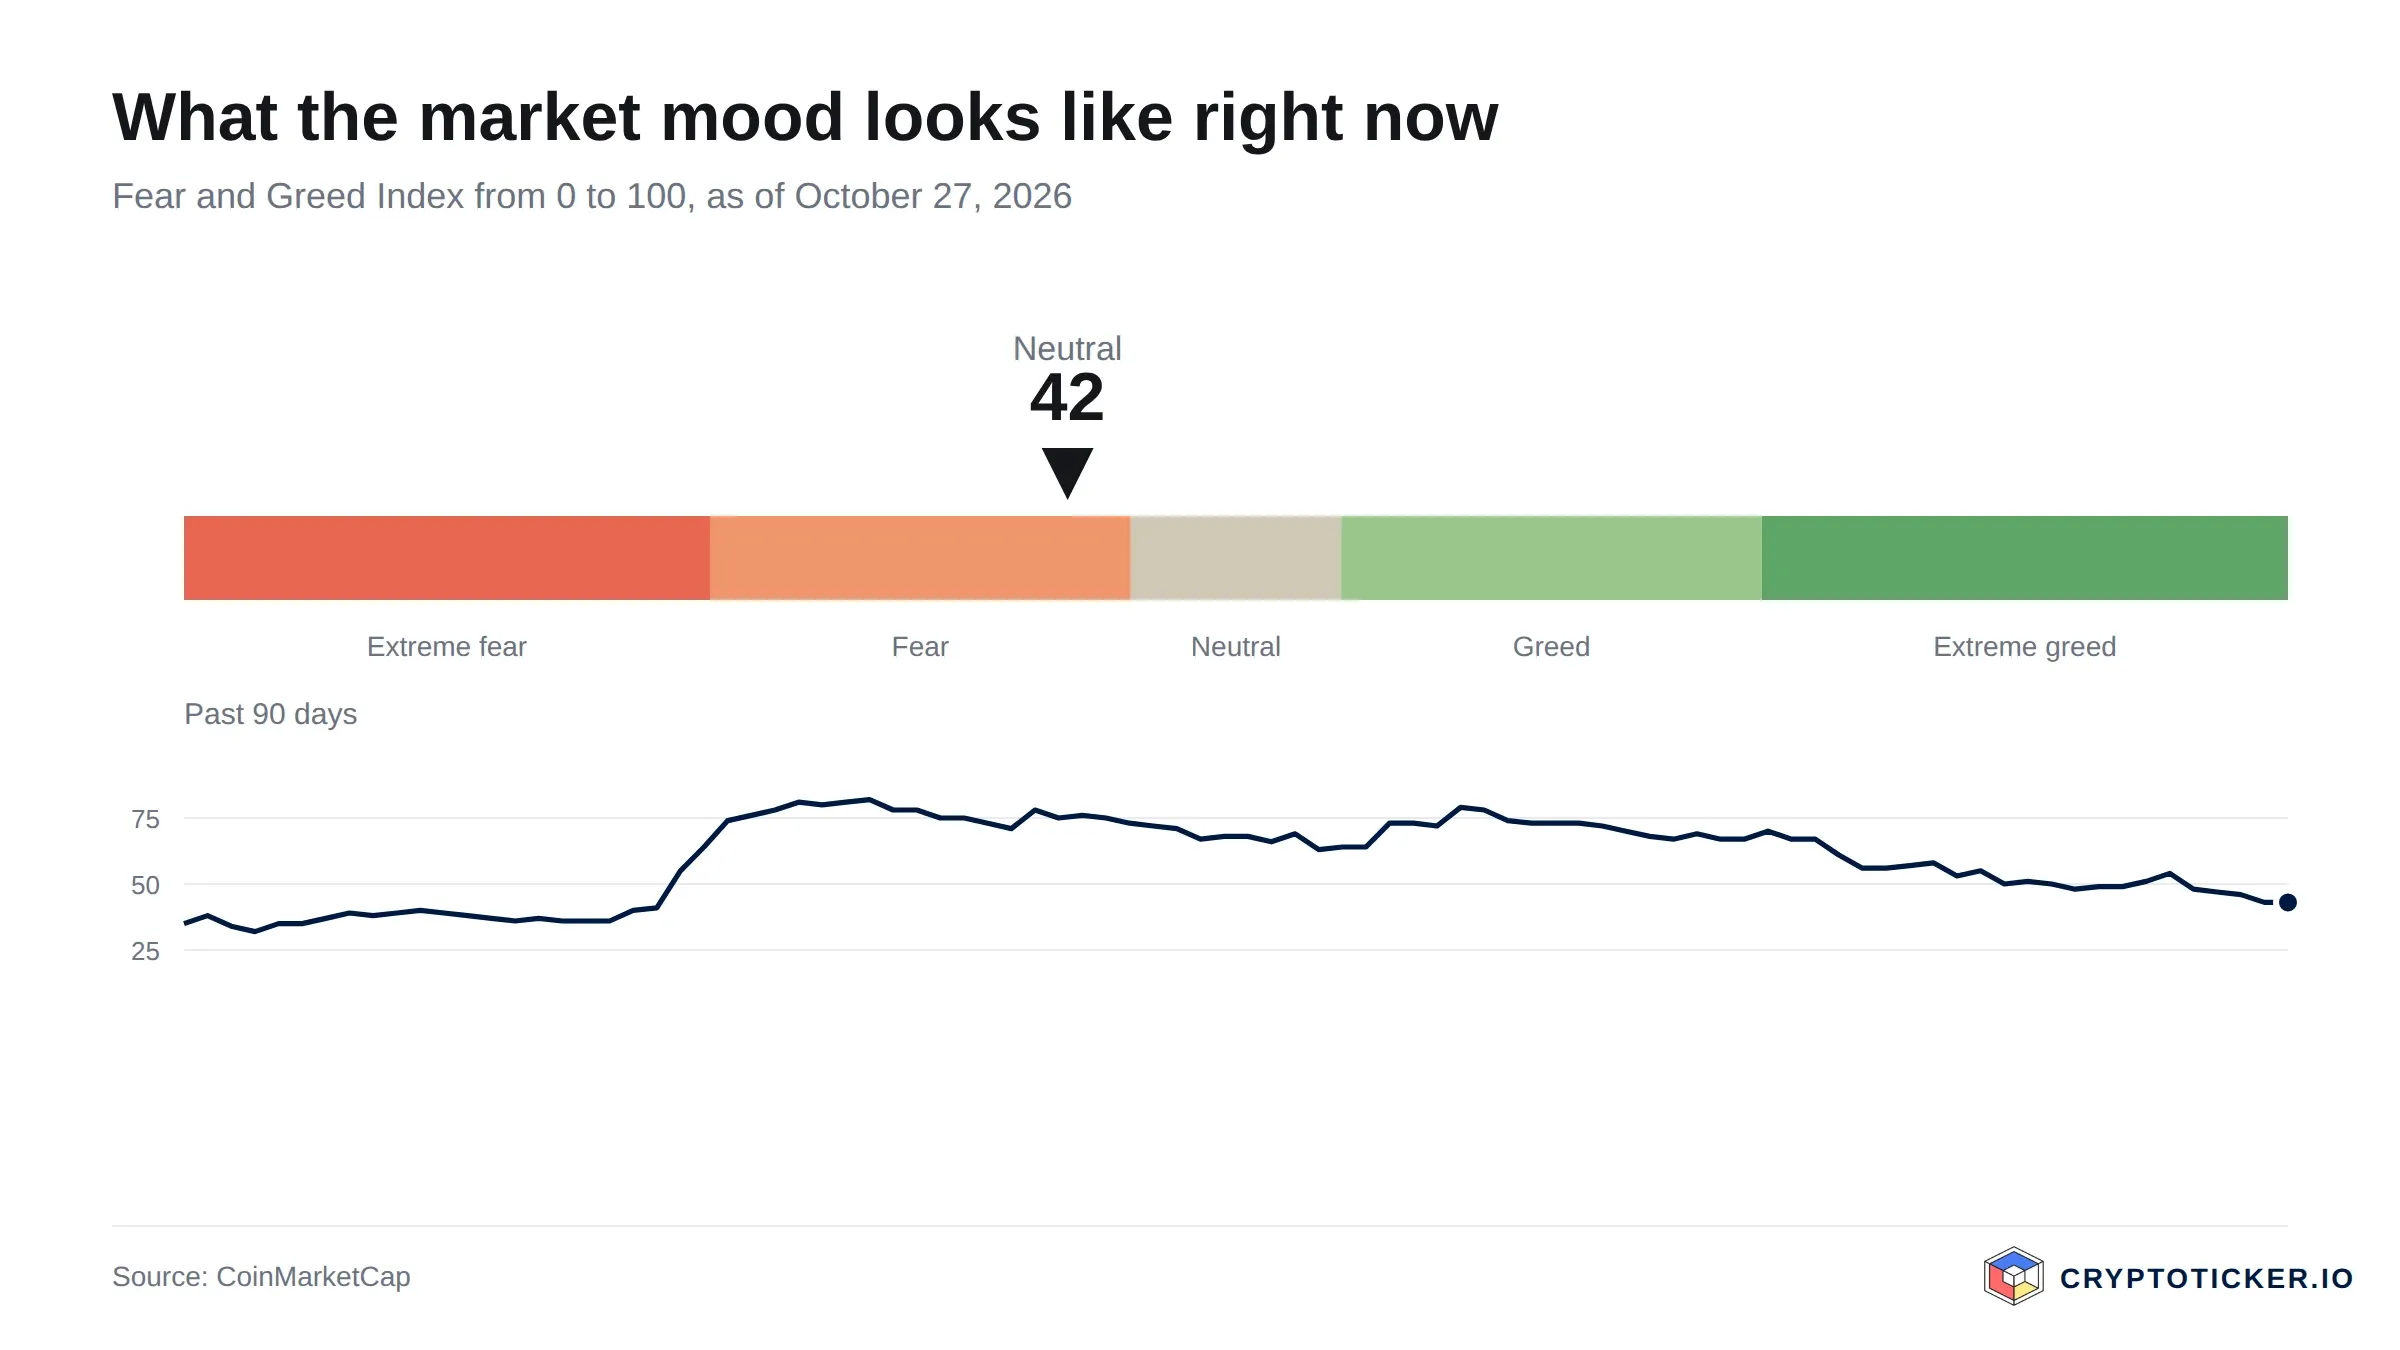
The Fear and Greed Index places market sentiment between extreme fear and extreme greed
First, supply keeps growing. With no maximum supply and around 40 per cent of the total supply still outside circulation, every price gain has to absorb additional tokens. In weak phases, that pressure works against the price even when nothing about the project changes.
Second, the recovery rests on thin trading. Daily turnover of 32.9 million dollars lies below the 30-day average of 39.5 million, while the September record was reached on markedly higher volume. A rise without rising turnover is the weaker form of a rise.
Third, the risk profile is that of a small position. The twelve-month low of 0.95 dollars and the twelve-month high of 31.92 dollars span a range in which drawdowns of 30 to 50 per cent are part of normal operations. Venice Token also depends on the AI sector keeping its current standing with investors, and that is a sentiment factor which can change faster than the project itself.
How to buy Venice Token at the current price
VVV is not listed everywhere. Availability is the first thing to check, and it is worth comparing the exchanges that carry the token against each other rather than taking the first one that does. Our overview of regulated crypto exchanges with a MiCA licence shows which providers operate under European supervision, which matters more for a mid-cap token than for Bitcoin, because listing and delisting decisions hit smaller markets harder.
On costs, three items decide the outcome: the trading fee, the spread between buying and selling price, and the deposit method. On smaller tokens the spread is usually the larger item, and it widens in volatile phases. Our experience reports on Kraken and Bitvavo set out the fee models in detail, including the difference between the simplified buying mask and the exchange view, which is often the cheaper route for the same order.
Custody is the second decision, and it is independent of the exchange. Anyone planning to hold for longer moves the tokens off the trading venue. Our hardware wallet comparison lists the devices and their supported networks, which is worth checking for a Base-based token before buying. Anyone intending to use the staking quota on the platform should be aware that the token has to be locked there, which rules out cold storage for that portion of the holding.
Is Venice Token a good buy at the current price?
For the short term, the picture is neutral with a slight downward tilt. The RSI at 51 gives no signal, volume lies below its averages, and the price sits only 2.8 per cent above the 50-day average, which is too little buffer to call the correction over. A short-term buy would be a bet on the 50-day average holding at 23.88 dollars. If it does not, the next technically meaningful zone is far below.
For the long term, the assessment is friendlier, provided the usage case holds. The price remains 47.0 per cent above the 200-day average, demand is tied to a product rather than purely to expectations, and the correction has so far not broken the upward structure. The decisive variable is not the chart but the platform: if the inference quota attracts paying users, the staking demand carries; if it does not, the token falls back on sentiment alone.
This assessment counts as refuted under two conditions. It is refuted on the downside if Venice Token closes below the 200-day average at 16.70 dollars, because the entire upward structure described here then no longer exists. It is refuted on the upside if the price rises above 31.92 dollars on turnover above the 90-day average of 39.3 million dollars, because the correction would then be over and the entry assumed here would have been too cautious. Neither case is a forecast; both are the marks at which this article should be read again.
Buying Venice Token: Your next three steps
- Check availability and costs first: not every venue lists VVV, and the spread on smaller tokens weighs more heavily than the trading fee. Our comparison of regulated exchanges shows which providers operate under European rules.
- Decide on custody before the purchase, not afterwards. For holdings meant to stay in place for longer, the hardware wallet comparison shows which devices support the Base network.
- Set your marks in advance. The 50-day average at 23.88 dollars and the 200-day average at 16.70 dollars are the two levels at which the assessment changes; the longer-term scenarios are set out in our Venice Token price prediction.
Disclosure: Some of the providers mentioned in this article work with us through partner programmes. This has no influence on the price analysis or on the assessment of the chart situation; the price data comes from a public market data source and can be verified there.
(As of 27 October 2026. This article is not investment advice. Prices, fees and terms change; check them with the provider before every purchase. Crypto assets are subject to high price volatility, and a total loss is possible.)