KITE Unlock Estimates and the Data Behind Token Supply Differences KITE unlock estimates are all over crypto dashboards right now. One page lists 640 million tokens. Another lists 1.11 billio
KITE Unlock Estimates and the Data Behind Token Supply Differences
KITE unlock estimates are all over crypto dashboards right now. One page lists 640 million tokens. Another lists 1.11 billion. A third points to a monthly release worth about $32.7 million.
So which number is right? Often, none is wrong. Each tracker simply counts different things.
What Is Kite AI and What Does the KITE Token Do?
Kite AI is a blockchain built for payments made by AI agents. The project describes it as a proof-of-stake, EVM-compatible Layer 1.
That means a standalone network that runs Ethereum-style smart contracts. Agents are meant to carry a verifiable identity and follow programmable spending rules.
KITE is the network's native token. The project says its utility rolls out in two phases. Phase 1 covers module liquidity locks, ecosystem access, and incentives. Phase 2 adds staking, governance, and AI service commissions after mainnet.
The project also says it raised $35 million from backers that include PayPal, General Catalyst, and Coinbase Ventures. That's a project claim, not an independently verified figure.
The token design matters here. Locks, vesting, and allocations all feed the release math, so KITE Unlock Estimates start from these rules.
What Do the Official KITE Tokenomics Say?
The tokenomics documentation caps total supply at 10 billion KITE. Initial token allocations are split four ways:
Allocation
Share
Stated purpose
Ecosystem and Community
48%
Airdrops, liquidity, growth
Modules
20%
Developer grants and rewards
Team, Advisors, Early Contributors
20%
Multi-year vesting
Investors
12%
Structured vesting
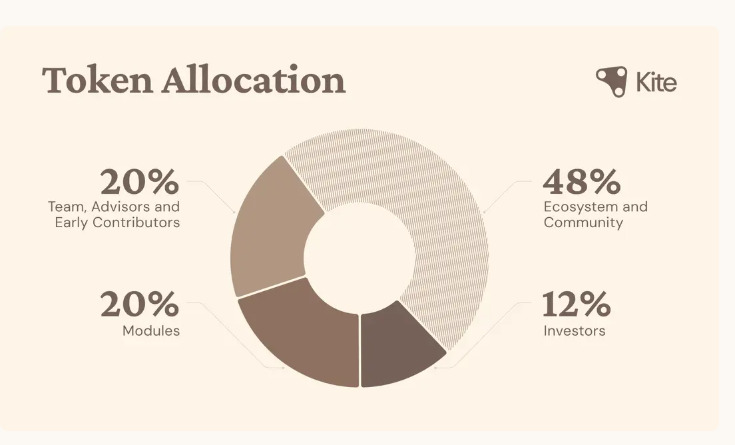
The table shows shares, not dates. The documentation doesn't list a day-by-day schedule. That gap is where KITE Unlock Estimates begin, because trackers fill it with their own assumptions.
The MiCA whitepaper adds timing, as summarized in public reporting. Team and investor tokens face a one-year lockup, then a four-year release. Ecosystem tokens had 30% available at launch, with the rest releasing linearly over four years. Modules had 60% available at launch.
How Do Vesting Periods and Cliff Schedules Shift the Numbers?
Vesting periods work like a release timetable. They decide when locked tokens finally reach their holders. A cliff is a lockup that ends all at once. Linear vesting releases equal slices over time.
KITE uses both. One tracker page describes most allocations as cliff-based. The same page calls the vesting linear, especially for ecosystem tokens. Both statements are partly true, yet they lead to different charts.
Cliff schedules also create a timing trap. Some trackers count the first linear slice on the cliff day. Others count it separately. That may explain part of the gap between 640 million and 1.11 billion tokens.
This is where KITE Unlock Estimates first drift apart. Theproject's published documentation gives the structure, not the day-level math.
Why Do Token Allocations Produce Different Totals?
The same release can look very different on paper. The market note on the CoinMarketCap Top Stories page cites three calendars. The note is AI-generated and carries a warning that it can make mistakes.
Reported view
Tokens
Approx. value
Stated basis
Calendar one
640 million
$75.6 million
17.42% of circulating supply
Calendar two
640 million
$78.3 million
17.41% of 3.68 billion released supply
Calendar three
Not stated
$131.88 million
46.38% of market cap
Note: The figures in this table come from a market note published on CoinMarketCap on November 3, 2026. They reflect each calendar's own assumptions and the prices on its publication date, so they may differ from current live data.
The first two agree on tokens and differ by about $2.7 million. That gap looks like a price-timing difference. Calendar three sits about 1.7 times higher. It probably counts more tokens, uses a higher price, or does both, but it never says which.
That brings up the second reason KITE Unlock Estimates disagree: each calendar decides for itself which token allocations to count.
How Do Monthly Supply Projections Change the Picture?
One projection shows about $32.7 million of KITE releasing each month until October 2029. A tracker's vesting page says the full schedule stretches into 2030.
Both can hold up. A one-year cliff plus a four-year release would run to roughly November 2030 for team and investor tokens. A monthly figure that stops in 2029 likely covers fewer allocations.
Dollar-based projections add another wobble. They move with the token price, which sat near $0.12 in early November. That makes KITE Unlock Estimates hard to compare unless the price date is stated.
How Do Tracker Methodologies Change Circulating Supply?
Circulating supply is the number of tokens available to trade. No universal rule defines it. The live CoinMarketCap page lists 3.67 billion KITE, or 36.77% of the 10 billion total.
Market value metrics split too. The same page shows a market cap of $443.79 million, an unlocked market cap of $444.15 million, and an FDV of $1.2 billion. Market cap uses circulating supply. FDV assumes all 10 billion tokens are in the market.
Even one tracker can disagree with itself. An earlier snapshot showed 23.91% unlocked and November 3 as the next event. The current page shows 43.24% unlocked and no upcoming cliff.
"Unlocked" and "circulating" aren't the same thing, either. Methodology is the quietest driver of KITE Unlock Estimates.
Which Date Counts for the KITE Unlock?
Public coverage points to November 1, November 3, and November 17. Each date reshapes KITE Unlock Estimates differently. The second matches the first anniversary of the trading launch. The third echoes an admission date in the whitepaper.
As of November 4, 2026, the November 3 date has passed. The tracker pages reviewed still show mixed figures, so the final tally looks unsettled.
What Could a Large Release Mean for KITE Supply?
The base changes the headline in KITE Unlock Estimates. The same 640 million tokens equal about 17% of a 3.68 billion released-supply base. Against the 2.39 to 2.57 billion circulating figures, that jumps to roughly 25% to 27%.
One analysis noted the price slid from about $0.147 on October 5 to about $0.123 on November 2, roughly 16%. It linked the slide to the pending release. Broader market weakness may also have played a part, so the cause stays unproven. Large KITE Unlock Estimates also shape price narratives, yet supply is only one input.
How Can Readers Sanity-Check KITE Unlock Estimates?
A few quick checks can clear up the confusion around KITE Unlock Estimates:
Check which base a percentage in KITE Unlock Estimates uses: circulating, released, unlocked, or total supply.
Note the date and token price behind any dollar value.
Cross-check wallet activity on theofficial KiteScan explorer.
Read KITE Unlock Estimates as modelled outputs, not announcements.
What Should Readers Take From KITE Unlock Estimates?
The supply cap and allocation split are clear. What’s missing is a day-by-day release calendar. None of the pages reviewed publish one.
Without that calendar, KITE Unlock Estimates end up varying from one tracker to the next. Vesting periods, cliff schedules, token allocations, monthly supply projections, and tracker methodologies all pull in different directions.
Still uncertain: each tranche's exact size, which buckets each tracker counts, and what recipients will do. Theofficial project website and on-chain data remain the cleanest places to verify any single figure.
Disclaimer:
This article is for information only and is not financial advice. Crypto assets are volatile, and token unlocks can affect supply and price. Readers should research independently and consult a licensed adviser before making financial decisions.