LAB is trading near $0.0797 after a 72% daily jump, per CoinMarketCap. Base case points to a $0.075 to $0.088 range this week. A bullish break above $0.0865 opens the door toward $0.118, whil
LAB is trading near $0.0797 after a 72% daily jump, per CoinMarketCap. Base case points to a $0.075 to $0.088 range this week. A bullish break above $0.0865 opens the door toward $0.118, while losing $0.0664 support would invalidate the setup and drag the price back toward $0.045.
A sudden double-digit jump in a small-cap token tends to grab attention fast, and that is exactly what happened with LAB price prediction searches over the past day. The reason has less to do with hype and more to do with what showed up on the chart and in volume.
LAB Coin Sees Sudden Rally as Trading Volume Explodes Overnight
LAB spent weeks grinding lower inside a falling channel before volume came in almost overnight. Retail traders noticed the green candle first, then came the questions about whether it can hold.
Is this the start of something bigger, or a fast fade waiting to happen?
Key Takeaways
Direction: Short-term momentum has turned bullish after a sharp volume-driven breakout.
Reason: Trading volume surged over 900% in 24 hours alongside a bounce off record lows.
Short-term range: Roughly $0.075 to $0.088 over the coming days.
Invalidation: A drop back below $0.0664 support would weaken the bullish case.
LAB Coin Overview and Why This Token Keeps Trending Today
Field
Detail
Coin Name
LAB
Ticker Symbol
LAB
Blockchain
BNB Smart Chain (BEP-20)
Today High
$0.08528
Today Low
$0.0464
RSI Level
67.91 (4H)
Token Type
Utility / Trading token
Token Category
DeFi, Cross-chain trading
Contract Address
0x7ec43cf65f1663f820427c62a5793a
Market Cap
$47.33M
24H Trading Volume
$75.25M
24H Trading Volume Change
+913.84%
Circulating Supply
594.12M LAB
24H Change
+72.38%
Source: Data by CoinMarketCap
What Is LAB Token and Why Beginners Are Asking Now
LAB runs on the BNB Smart Chain as a trading focused token built to connect activity across ecosystems from one dashboard. Per the project's official X account, it lets traders access chains like Ethereum, Solana, Base, and Monad without switching platforms.
Source: Official X Account (@LABtrade_)
LAB Price History Shows a Painful Drop Before This Bounce
LAB hit an all-time high of $27.22 on June 3, 2026, and has since fallen more than 99%. Just two days before this rally, it touched a fresh all-time low of $0.0411 on September 10, 2026; now the floor traders are watching forLAB comeback potential.
Why LAB Coin Matters Now Beyond Just the Price Spike
LAB carries a CertiK security rating of 4.2 out of 5, a baseline of contract credibility many small caps lack. Community attention has also picked up around its cross-chain pitch, with a recent project post pulling over 21,000 views.
LAB Whale Concentration Data Raises Fresh Questions for Holders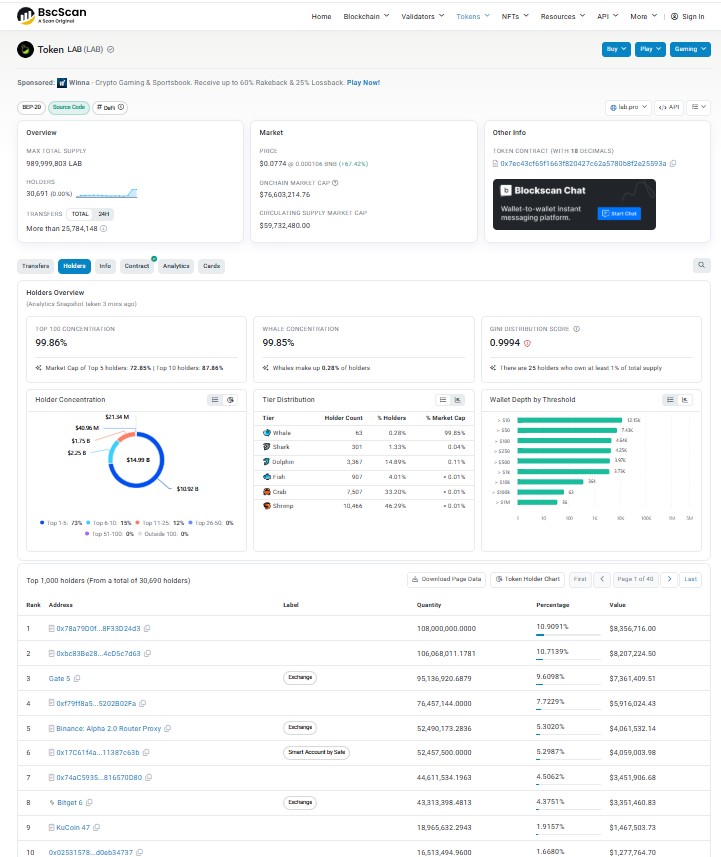
Whale wallets make up just 0.28% of holders but control 99.85% of circulating market cap per BscScan data. The top 10 wallets alone hold roughly 87.86% of the supply; several of them exchange wallets rather than individual holders.
LAB Technical Analysis: Price Breaks Descending Channel
Price broke above a multi-week descending channel on the 4-hour chart, moving from $0.0464 to $0.08528, and now trades above the 50 EMA at $0.06523. RSI reads 67.91, approaching overbought but not extreme, after bouncing from near 20 days earlier.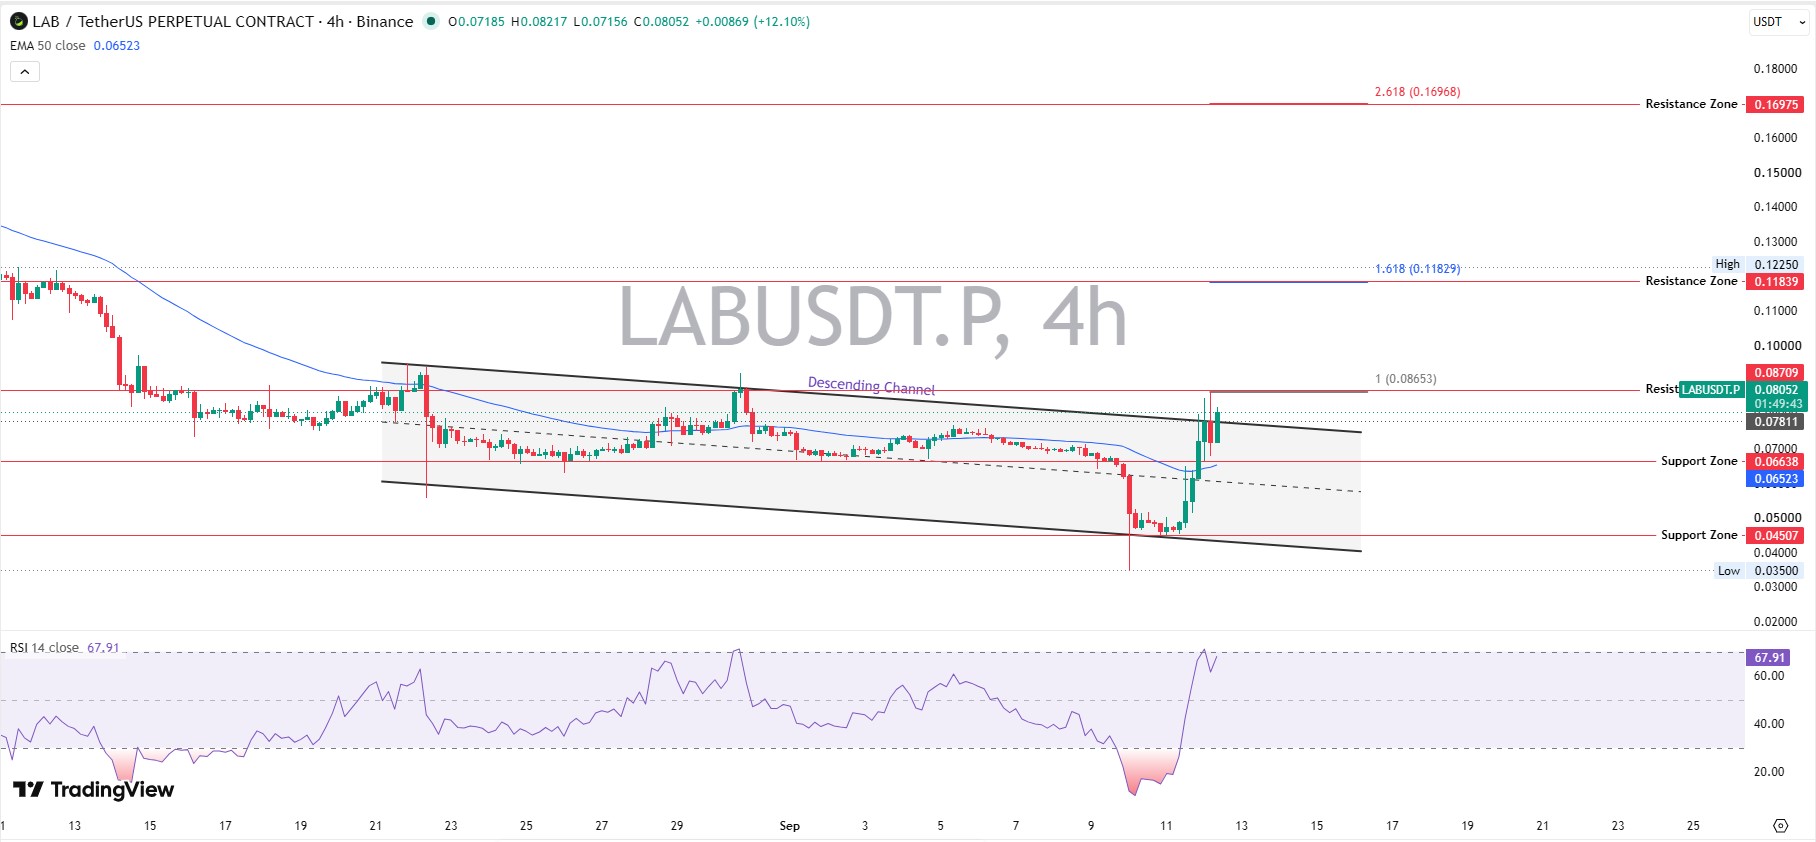
Nearest resistance sits at $0.0865 to $0.0871, the channel's upper edge and a prior swing high. Support rests at $0.0664, with a deeper floor at $0.0451. A close above $0.0865 on rising volume confirms continuation toward $0.1184; losing $0.0664 flips the setup bearish, echoing theliquidity pull analysis from the earlier crash.
Source:TradingView chart analysis
LAB vs. Other Small Cap BSC Tokens: How the Rally Compares
Sharp rallies are common among thin-float BSC tokens, but a 913% volume spike in a day is unusual even for this category, and that scale of turnover has drawn extra scrutiny.
Short-Term LAB Price Prediction: Where the Coin Could Head Next
The next few days will likely stay volatile as traders test whether the breakout holds above base support.
Timeframe
Bearish Target
Base Level
Base Target
Bullish Level
Bullish Target
Invalidation
24 Hours
$0.0664
Base Support
$0.0780
50 EMA
$0.0865
Break below Base Support
3–7 Days
$0.0600
Key Zone
$0.0800
Key Resistance
$0.0900
Lose Key Support
2–4 Weeks
$0.0550
Key Resistance
$0.0950
Major Resistance
$0.1184
Weekly close below Lower Support
Watch $0.0865 closely, since a weekly close above it is the level bulls need to keep this move alive.
Long-Term LAB Price: Can It Recover Further From Record Lows
The long-term case depends on whether volume stays elevated or fades once the excitement cools.
Timeframe
Bearish Target
Base Level
Base Target
Bullish Level
Bullish Target
Catalyst Needed
3 Months
$0.045
Weekly EMA 50
$0.090
Weekly Resistance
$0.130
Hold weekly support and rising volume
6 Months
$0.038
Key Resistance Zone
$0.110
Major Resistance
$0.170
Ecosystem growth and sustained demand
End of Year
$0.030
Major Resistance
$0.140
Major Breakout Zone
$0.220
Break above major weekly resistance
2027 Outlook
$0.025
Major Resistance
$0.200
New ATH Extension
$0.350
Adoption growth and broader crypto bull market
The long-term case leans fragile. With concentration this high and the token still down over 99% from its peak, real recovery needs user growth, not one volume spike.
Three Price Scenarios for LAB Coin: What Could Play Out
Worst Case: A fade in volume drags LAB below $0.0664, and whale profit-taking pushes price toward $0.045, similar to thenext liquidity move breakdown.
Base Case: Price consolidates between $0.065 and $0.088 while the market waits for fresh volume.
Best Case: A confirmed breakout above $0.0865 with sustained volume pushes LAB toward $0.118.
Scenario
Price Range
What Triggers It
Worst Case
$0.035 - $0.055
Volume fades, whales sell into strength
Base Case
$0.065 - $0.088
Sideways consolidation, mixed volume
Best Case
$0.088 - $0.118
Breakout holds, fresh buying volume enters
Key LAB Price Levels to Watch Before Next Big Move
Resistance zone:$0.0865 to $0.0871, the descending channel's top and a prior swing high.
Support zone:$0.0664; the level price needs to hold to keep the short-term structure intact.
Invalidation zone: Below $0.0451, reopening the path toward the recent low near $0.0411.
LAB Analyst View and Final Thoughts on This Volatile Rally
When we pulled up the LAB chart, the first thing that stood out was how fast price moved off a fresh all-time low. That is not typical, and it usually means something outside the chart triggered the move.
RSI near 68 without being deeply overbought leaves room for more upside, but this is not calm accumulation. A weekly close above $0.0865 would be the clearest signal yet that buyers are serious.
One factor to track beyond the chart is whale behavior. With nearly 88% of supply held by ten wallets, one large sell order can undo days of gains.
The most important level for this LAB price prediction right now stays $0.0664. Hold it, and the bullish case survives. Lose it, and this looks like a short-lived squeeze.
That's the level that decides everything.
LAB Risk Factors Traders Should Not Ignore
Liquidity risk: Thin order books can cause sharp slippage in both directions.
Volatility risk: A 72% daily move can reverse fast if volume dries up.
Concentration risk: Whale wallets holding nearly 88% of supply can break the thesis with one large sell order.
Disclaimer
This article is for educational purposes only and does not constitute financial advice. Crypto markets are volatile. Consult your investment advisor before making any investment decision.