XRP is back in focus after a 6.5% rally today pushed its price to approximately $1.50. The token’s recovery also got attention from two prominent market analysts, although they are looking at
XRP is back in focus after a 6.5% rally today pushed its price to approximately $1.50. The token’s recovery also got attention from two prominent market analysts, although they are looking at very different XRP price levels.
Veteran trader Peter Brandt has published a long-term XRP chart implying an eventual advance to $5.40. Meanwhile, crypto analyst Ali Martinez says reported whale accumulation and on-chain data put $1.60 in focus as the next major area where sellers could emerge.
The two forecasts tell different parts of the same story: XRP has recovered in the short term, but substantial technical obstacles remain before Brandt’s much larger target comes into play.
Peter Brandt’s XRP Chart Points to an Eventual $5.40
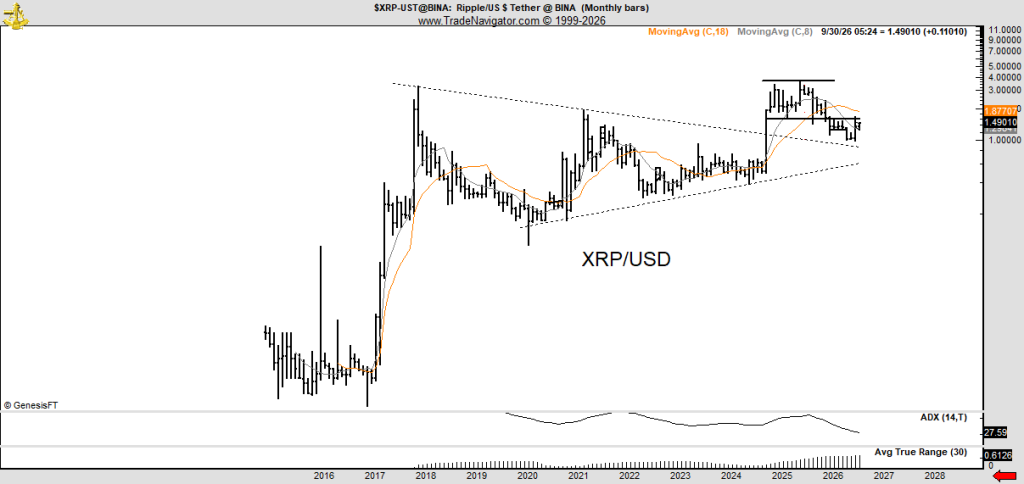
In a post on X, Brandt shared his long-term XRP chart and wrote that it implies an eventual advance to $5.40.
He also made an important distinction: publishing a chart or making a market call is not the same as executing a trade. Brandt argued that anyone claiming to have traded a particular move should provide evidence rather than treating an X post as proof.
His chart uses monthly XRP price data, making it a long-term technical outlook rather than a forecast for the next few trading sessions.
The most striking feature is the broad consolidation structure stretching across several years. A descending trendline connects major historical highs, while a rising lower boundary traces XRP’s longer-term support. Together, they illustrate a market that spent years compressing before its substantial advance in late 2024 and early 2025.
 Source: X/@PeterLBrandt
More recently, XRP has pulled back from the upper portion of that structure. The chart shows price near $1.49, below both the orange 18-month moving average around $1.88 and the shorter moving average.
That matters because the recent rebound has not yet repaired the broader monthly trend. XRP would need to reclaim nearby overhead resistance and establish stronger monthly closes to support a sustained recovery.
Brandt’s chart also marks resistance around the previous trading range above $3 and a higher horizontal boundary near $4. These are meaningful obstacles on the way to his stated $5.40 objective.
At $1.50, a move to $5.40 would represent approximately 260% upside. However, Brandt did not specify when that target might be reached, and his chart does not establish that such a rally is imminent.
Read also: Analyst Who Called XRP at $0.28 Sees Huge Ethereum Setup
Ali Martinez Says XRP Whales Have Accumulated More Than $2 Billion
While Brandt is focused on XRP’s long-term structure, Ali Martinez is examining what could happen next.
Martinez reported that whales recently accumulated more than $2 billion worth of XRP. He also noted that the token had risen 8.22% over three days, describing the price recovery as a possible sign that demand was becoming visible in the market.
The accumulation figure is Martinez’s reported interpretation of on-chain activity; the chart provided does not independently establish the timing or execution of those purchases.
His more immediate finding comes from the UTXO Realized Price Distribution (URPD) chart, sourced to Glassnode. The chart groups XRP according to the prices at which coins last moved on-chain, helping identify areas where substantial amounts of supply have a recorded cost basis.
The longest bar on the chart appears near $1.60, where approximately 2.5 billion XRP previously changed hands. That makes it an important level to watch as the token approaches it from below.
Holders with a cost basis around $1.60 could choose to sell when price returns to that area, potentially creating resistance. But a large URPD bar does not guarantee selling: some holders may continue holding, while others may have transferred their tokens without making a conventional market purchase.
The chart also shows substantial supply concentrations around $1.31, $1.37, $1.68, $1.86 and $2.29. These clusters could become relevant if XRP continues moving in either direction.
Can XRP Price Break $1.60 and Begin Its Journey Toward $5.40?
The two analysts’ charts establish a sequence of levels worth monitoring. Let’s talk about our XRP price outlook.
XRP price
Importance
$1.31–$1.37
Significant lower cost-basis clusters on the URPD chart
$1.49–$1.50
Current recovery area
$1.60
Martinez’s next major resistance; roughly 2.5 billion XRP previously changed hands
$1.68
Another notable supply concentration
$1.86–$1.88
URPD cluster and Brandt’s 18-month moving average
Above $3
Historical overhead resistance on Brandt’s monthly chart
$5.40
Brandt’s eventual long-term objective
For the immediate bullish case, XRP must first sustain its recovery above $1.50 and confront the supply concentration at $1.60. A convincing move beyond that area could bring $1.68 and the $1.86–$1.88 region into view.
A rejection at $1.60, on the other hand, would leave open the possibility of a pullback toward the lower cost-basis clusters.
Brandt’s $5.40 forecast is a much bigger proposition. It would require XRP to overcome several layers of resistance and reverse the weakness still visible on his monthly chart.
For now, the rally has given XRP bulls something to work with, but Martinez’s $1.60 level is the nearer test.
For more crypto news and price predictions, click here.
Subscribe to our YouTube channel for daily crypto updates, market insights, and expert analysis.
The post Legendary Trader’s XRP Price Prediction Goes Well Beyond $3 appeared first on CaptainAltcoin.