So, What's Going On With MNT Lately? If you've glanced at MNT's chart recently, you'll have noticed it's had a rough go of things for most of this year. That's exactly why this Mantle price p
So, What's Going On With MNT Lately?
If you've glanced at MNT's chart recently, you'll have noticed it's had a rough go of things for most of this year.
That's exactly why this Mantle price prediction is worth a closer look right now because something does appear to be shifting.
Price has started moving with a bit more energy; trading volume has picked up noticeably, and underneath all that, the Mantle network itself hasn't skipped a beat, still churning through hundreds of millions of transactions with new blocks landing every couple of seconds.
None of that guarantees anything, but it's the kind of backdrop that tends to get traders paying attention again.
Where Does MNT Stand Right Now?
As perCoinMarketCap data, MNT is sitting at $0.5224, up 9.59% on the day, which puts its market cap at $1.72 billion, also up 9.59%. Its fully diluted valuation runs a fair bit higher, at $3.24 billion.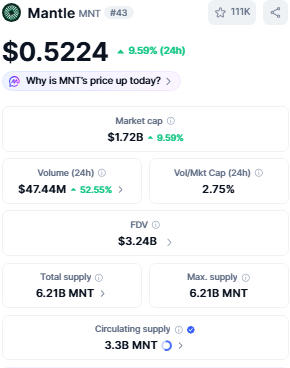
Trading volume over the last 24 hours came in at $47.44 million, up a solid 52.55% from the day before, which works out to a volume-to-market-cap ratio of 2.75%.
On the supply side, MNT's total supply and maximum supply are actually the same number, 6.21 billion tokens, and right now about 3.3 billion of those are in circulation.
What's Happening on the Futures Side?
According toCoinglass data, MNT is up 0.57% over 4 hours, 9.89% over 24 hours, 16.92% over a week, and 27.65% over the past month, though zoom out further and the picture gets rougher, with a 19.89% drop over 90 days, an 11.37% drop over 180 days, and a steep 45.59% decline year-to-date.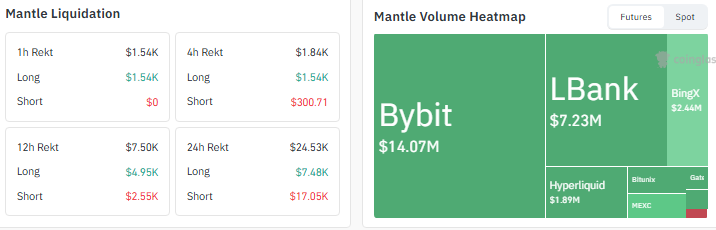
Most of the futures action is happening on Bybit, which handles 7.23 million, and BingX (1.89 million), making up the rest. Liquidations have been fairly quiet, just $24.53K over the past 24 hours, tilted toward shorts at $17.05K versus $7.48K in longs.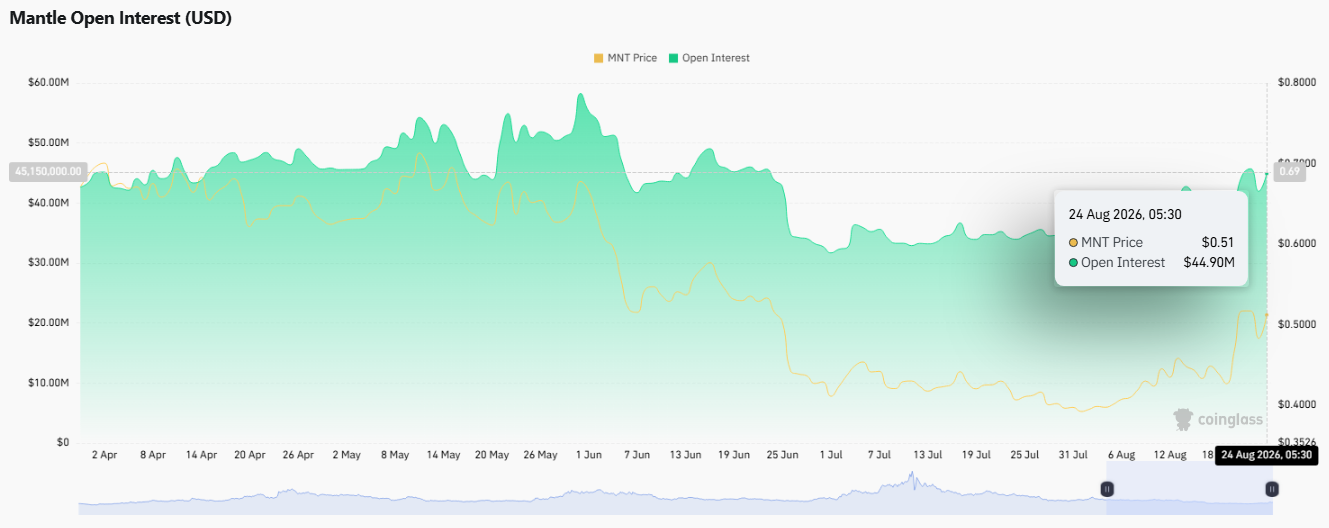
Open interest was last seen at $44.90 million, holding steady even as MNT's price cooled slightly from its intraday peak.
Reading the Chart: What Changed?
Here's the thing about MNT's chart over the past couple of months: it's been grinding lower inside what's known as a falling wedge, a pattern that squeezes price into a narrowing range and, more often than not, ends with a breakout to the upside.
That's essentially what's happened. MNT pushed above the wedge and, unlike a lot of fakeout moves you see in this market, it's actually held there instead of sliding straight back in.
Looking at the TradingView chart for MNT/USD, the 14-period RSI is sitting at 66.51 right now, which tells you momentum is genuinely bullish without being stretched thin yet.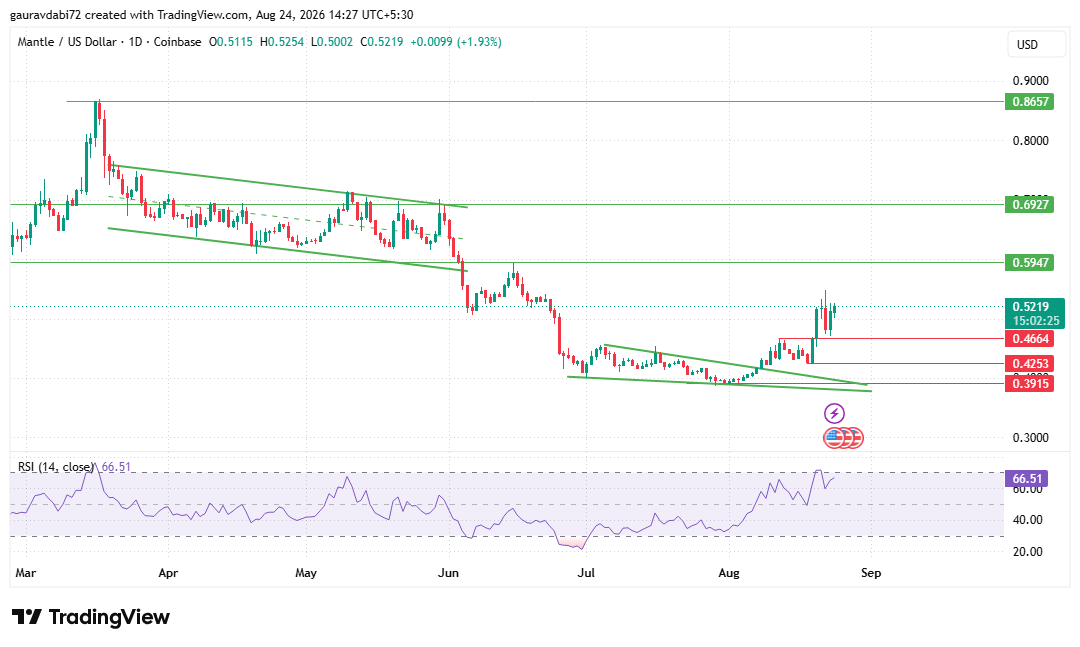
So what's next for this Mantle price prediction? The number to watch is $0.5947. Clear that and hold it, and $0.6927 comes into view pretty quickly, and if buyers really keep the pressure on, the price can go as far as $0.8657.
If $0.5947 turns out to be too tough a nut to crack, don't be surprised to see MNT chop around between $0.4664 and $0.5947 for a while instead.
And if things turn south, the levels to keep an eye on are $0.4664, $0.4253, and $0.3915.
Three Ways This Could Go From Here
To make it easier to follow, here's how the three scenarios in this Mantle price prediction stack up:
Scenario
What Would Trigger It
Key Levels to Watch
Bullish
MNT pushes past $0.5947 and actually stays there instead of fading back.
From there, the price can go on to $0.6927, and even $0.8657 isn't off the table.
Neutral / Range-bound
MNT keeps knocking on $0.5947 without quite breaking through.
Expect a chop between $0.4664 and $0.5947.
Bearish
Buyers lose interest, and MNT gives back its recent gains.
Watch $0.4664, then $0.4253, then $0.3915.
Peeking Under the Hood: Is the Network Actually Busy?
It's easy to get caught up in candles and forget there's an actual blockchain running underneath all this, so let's check in on that.
On-chain data fromMantle's own explorer shows MNT valued at roughly 0.000007 BTC, with the network's own market-cap reading of $1,725,381,811 against a circulating supply close to 3.3 billion tokens.
The chain has now processed over 294.44 million transactions in total, ticking along at around 0.8 transactions per second, with new blocks arriving roughly every two seconds, the latest sitting at block 99,716,356.
Over the past two weeks, daily transaction counts have mostly hovered between 40,000 and 60,000, with one noticeable spike toward 120,000 in the middle of that stretch.
So, Should You Be Watching MNT?
As per the Coingabbar analyst, between the wedge breakout holding up, volume picking up, and a network that's clearly still being used, there's enough here to make this Mantle price prediction genuinely interesting to follow.
That said, $0.5947 hasn't been cracked yet, and MNT's brutal year-to-date and one-year numbers are a reminder that one good week doesn't erase months of decline.
Disclaimer: This article is intended purely as market analysis based on publicly available prices, derivatives, and on-chain data and should not be read as investment advice. Readers are encouraged to do their own research before making any decisions.