What does it take for one token to keep climbing while Bitcoin keeps sliding? That's the question traders keep asking on October 24, 2026, 05:00 UTC, as MemeCore (M) pushes higher while Bitco
What does it take for one token to keep climbing while Bitcoin keeps sliding? That's the question traders keep asking on October 24, 2026, 05:00 UTC, as MemeCore (M) pushes higher while Bitcoin trades at $80,706.23, down 1.13% in 24 hours.
Today the $M token price sits near $0.96, and every MemeCore price prediction now hinges on whether a symmetrical triangle breakout holds.
MemeCore Price Today: Market Snapshot on October 24
As of October 24, 2026, 05:00 UTC, $M price today sits at $0.9635, up 24.0% over 7 days and holding the 47th spot by market cap.
Metric
Value
Price
$0.9635
Market cap
$2.209B
Fully diluted valuation
$5.237B
24h trading volume
$2.126M
Perps open interest
$21.764M
Circulating supply
2.29B M
Max supply
10B M
Source: Data taken from CoinGecko
Only about 22.9% of the 10B maximum supply circulates, so the MemeCore market cap rests on a small slice of the eventual tokens. And with spot volume near $2.126 million, traders followingmemecoin market news know a few large orders can move price fast.
MemeCore Holders: Whale Concentration and Supply Risk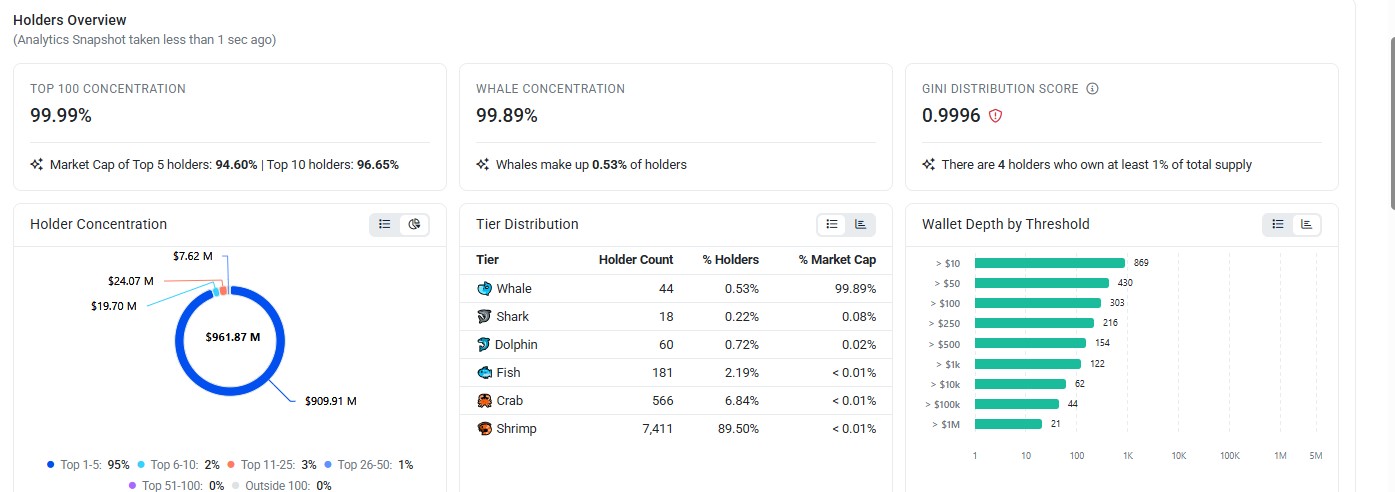
Holder data for the BNB Chain contract reads like a warning label, with the top 100 wallets controlling 99.99% of tracked supply, perBscScan holder data. Only four wallets own at least 1% of the total supply.
Whales, meaning the largest wallets, number just 44, yet they control 99.89% of market cap. And the Gini score, a gauge of inequality where 1.0 means one wallet owns everything, sits at 0.9996.
The tracked wallets hold about $961.87 million against a $2.209 billion market cap, so the snapshot likely covers only part of supply. So who really sets the price here?
MemeCore Liquidation Data: Shorts Take the Pain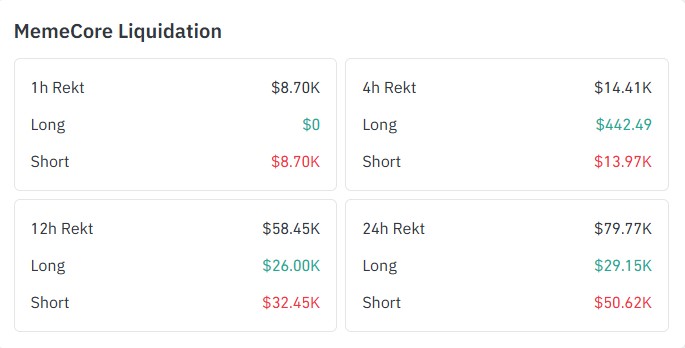
A liquidation happens when an exchange forces a borrowed-money trade shut after losses grow too big, and $M liquidation data shows short sellers taking most of the pain. PerCoinglass liquidation data, shorts lost $50.62K over 24 hours against $29.15K for longs.
The last hour went further, with $8.70K liquidated. Every bit of it on shorts. Still, that's small next to $21.764 million in perps open interest, meaning open positions in perpetual futures.
$M Futures Volume: Which Exchanges Lead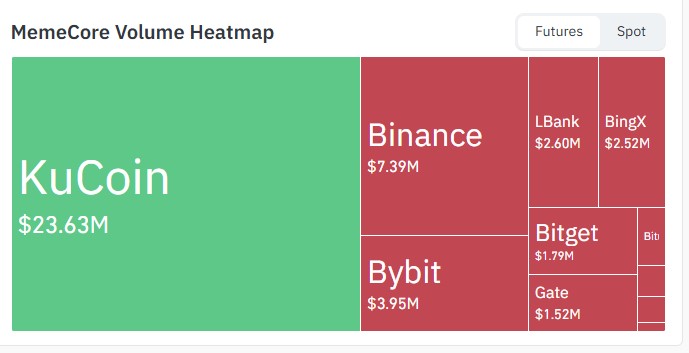
Source: Data Taken From CoinGlass
KuCoin Exchange leads the heatmap with $23.63M, well ahead of Binance at $7.39M and Bybit at $3.95M. Add LBank, BingX, Bitget, and Gate, and $M futures volume reaches roughly $43.4M, far above the $2.126 million spot figure.
MemeCore Technical Analysis: 1-Hour Chart Breakout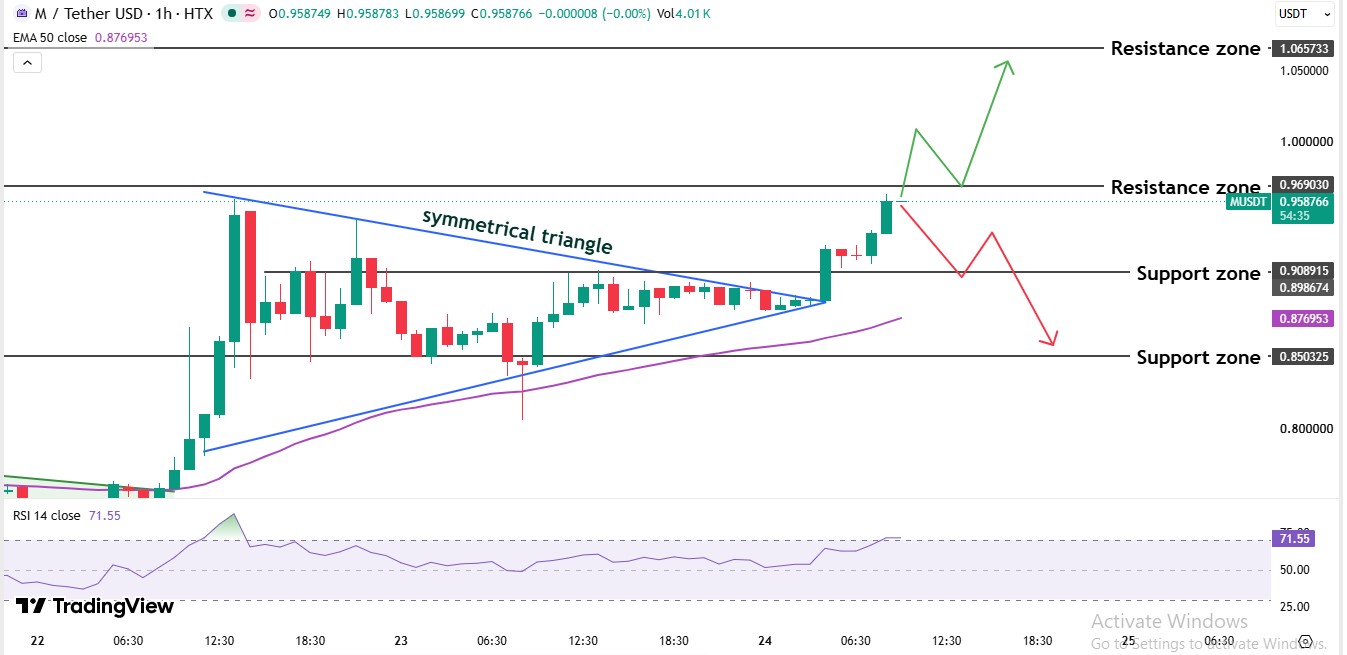
On this 1-hour chart, the story starts with a fast jump on October 22, 2026, when the price shot from about $0.78 to about $0.96 within a few hours. Buyers were in a charge.
After that sprint, the price moved sideways, which traders call consolidation. Through October 23, 2026, the ups and downs kept getting smaller as the price squeezed toward the middle, and the shape this made on the chart is called a symmetrical triangle, sitting between about $0.85 and $0.96.
Then the symmetrical triangle breakout came on October 24, when green candles pushed the price out through the top of that shape. Trading also stays above the 50-period EMA near $0.8770, a line that shows the average price of the last 50 hours.
Price break out of the triangle as fast. Right into the $0.9690 resistance zone, a price area where sellers have pushed back before, most recently on October 22. Buyers are now testing it near $0.9588, and breaking through could send the price toward $1.00, while a rejection would drag it back to the top of the triangle.
The RSI reading is 71.55, which usually means a rally needs a short rest. The rally feels stretched, although that might be too harsh, since the average price line keeps rising underneath.
MemeCore Price Prediction: Support and Resistance Levels
Support is a price area where buyers stepped in before, and resistance is where sellers did, so $M support and resistance zones anchor any MemeCore price forecast.
Level
Price
Resistance 2
$1.0657
Resistance 1
$0.9690
Support 1
$0.9089 to $0.8987
50-period EMA
$0.8769
Support 2
$0.8503
MemeCore Price Prediction: Bull Case, Base Case, and Bear Case
Scenario
Trigger
Target
Bull case
Trading holds above $0.9690
$1.00, then $1.0657
Base case
Price cools into support while RSI resets, then ranges
$0.9089 to $0.9690
Bear case
Rejection at $0.9690, then a slip under $0.8987
$0.9089 retest, then $0.8503
The $M bull case needs buyers to turn $0.9690 into support, while the base case is a cooling-off toward $0.9089 before momentum resets. The bear case starts with a rejection at that same ceiling. But concentrated holdings tilt the bear side heavier, because one whale exit can erase a week of gains in minutes.
And thin volume rarely forgives crowded rallies, so tracking whale moves throughcrypto market blogs makes sense.
MemeCore Price Forecast: M Token Price Expert Outlook
As per CoinGabbar analysis, the short-term bias is bullish, but only above $.9690, because a clean push through that ceiling targets $1.00 and then $1.0657. A $M price prediction built on structure still favors a pause first, with a retest of $0.9089 to $0.8987 as the likelier next step.
Under $0.8503, the setup flips bearish. But holder concentration caps conviction, and the reason is simple. A handful of wallets can undo a chart in a day. Caution fits better than excitement.
Disclaimer: This article is for information only and isn't financial advice. Crypto assets are highly volatile, and prices can move sharply in either direction. Readers should do independent research and consider their own risk tolerance before making any decision.