Key Highlights NEAR trading at $2.453 — 22% below the critical $3.00 neckline as a multi-year inverse H&S forms Analyst CryptoBullet1 identifies accumulation structure since March 2025 with 2
Key Highlights
- NEAR trading at $2.453 — 22% below the critical $3.00 neckline as a multi-year inverse H&S forms
- Analyst CryptoBullet1 identifies accumulation structure since March 2025 with 2027 breakout projection
- Measured move target: ~$6.00 (+145% from $3.00 neckline) on confirmed weekly close above $3.00
- Pattern invalidation level: weekly close below the head's low at ~$0.80–$1.00
NEAR Protocol is trading at $2.453 on the weekly chart — quietly printing what one analyst describes as one of the most compelling multi-year accumulation structures in the current cycle. Since March 2025, NEAR has been carving out a textbook inverse Head & Shoulders pattern below the critical $3.00 neckline, a formation that historically precedes some of the most explosive reversals in crypto markets.
The pattern was flagged by analyst CryptoBullet1 (@CryptoBullet1), who stated: “I really like what $NEAR has been printing here since March 2025. This accumulation structure below $3 reminds me of a classic inverse Head & Shoulders pattern. It will take a couple more months for the left shoulder to form. In 2027 $NEAR should break out.”
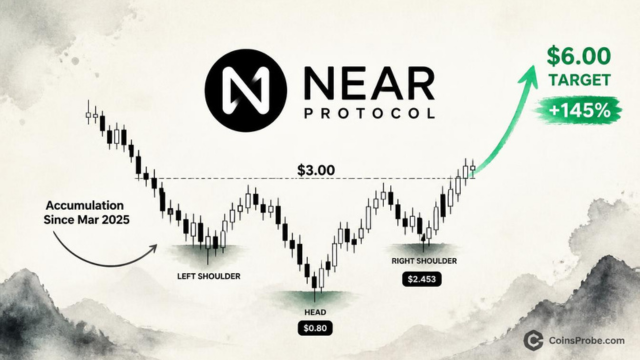
The weekly Bybit perpetual chart he shared shows a three-part structure spanning roughly 2025 through projected early 2027 — with a neckline sitting precisely at $3.00 and a measured move target of approximately $6.00.
The Pattern — What an Inverse Head & Shoulders Actually Means
An inverse Head & Shoulders is a bullish reversal formation. It develops when an asset prints three successive lows — a moderate low (left shoulder), a deeper low (the head), and then a higher low (right shoulder) — before breaking above the horizontal neckline that connects the peaks between each trough. The measured move target is derived by adding the depth of the head to the neckline breakout point.
The mechanics matter here: the pattern is not a prediction tool — it is an accumulation map. It identifies where buyers have systematically absorbed selling pressure across multiple timeframes. The longer the formation, the more compressed the eventual move tends to be. On NEAR’s weekly chart, the formation spans what will be approximately two full years by the time the right shoulder completes — making this one of the larger such structures currently visible across mid-cap Layer-1 protocols.
The Weekly Chart — Three-Part Structure Mapped
 NEAR Forming Inverse Head & Shoulders | Source: @CryptoBullet1 (X)
The NEAR/USDT Weekly chart shared by @CryptoBullet1 via TradingView reveals the following structure:
Component Approximate Timing Price ZoneLeft Shoulder Early 2025Sub-$3.00 bounce Head (deepest low) Mid-2026~$0.80–$1.00Right Shoulder (forming) Late 2026 / Early 2027Sub-$3.00 — in progress Neckline Horizontal resistance~$3.00 Measured Move Target Post-breakout~$6.00+
At the current price of $2.453, NEAR sits approximately 22% below the neckline at $3.00. The right shoulder is still forming — CryptoBullet1 notes that several more months of price action are required before the structure completes and a neckline breakout becomes viable. That projection places the potential breakout attempt in 2027.
This kind of patient, multi-year accumulation structure is worth tracking in the context of broader on-chain cycle dynamics. For readers following mid-cycle positioning signals, the Bitcoin UTXO Age Bands analysis flagging a mid-cycle floor provides useful macro context for where the broader market may be in the current cycle.
The $3.00 Neckline — Why This Level Is the Entire Trade
Every element of this setup converges on a single price: $3.00. It is simultaneously the neckline resistance for the inverse H&S pattern, the psychological round-number level that has capped NEAR’s recoveries since early 2025, and the breakout confirmation trigger that would activate the measured move.
The confirmation rule for an inverse H&S breakout is not ambiguous: the asset must close above the neckline on a weekly basis with volume expansion. An intraday wick above $3.00 does not constitute confirmation. A sustained weekly close above $3.00 — which CryptoBullet1 projects for 2027 — is what activates the pattern’s implied target.
The measured move math is straightforward:
- Head depth: ~$0.80–$1.00 (mid-2026 low)
- Neckline: ~$3.00
- Depth of head from neckline: approximately $2.00–$2.20
- Target: $3.00 + $2.00–$2.20 = ~$5.00–$6.00+
At the neckline ($3.00), that measured move represents roughly 100%–145% upside. From the current price of $2.453, the full projected move to $6.00 represents approximately ~145% gain — but this requires breakout confirmation first.
What the Pattern Says — and What It Doesn’t
What it says: NEAR has been in a structured accumulation phase since at least March 2025. The lows are getting progressively more defined, and the pattern resembles a classic bullish reversal formation on the weekly timeframe. If the right shoulder completes and the neckline is broken with a sustained weekly close above $3.00, the measured move targets approximately $6.00.
What it doesn’t say: This is not a near-term trade setup. CryptoBullet1 explicitly notes the right shoulder still requires months to complete. The pattern has not yet triggered — it is a forming structure, not a confirmed breakout. Weekly-timeframe patterns of this scale take time, and premature entries ahead of neckline confirmation carry significant invalidation risk.
What to watch for continuation: A sustained weekly close above $3.00 with volume expansion. Until that occurs, the structure remains in formation — accumulation, not breakout.
The patience required for multi-year pattern setups is a theme familiar to long-cycle analysts. The Bitcoin STH-SOPR analysis from 2023 offers a comparable case study in how structural market data reads during extended accumulation phases before major moves materialize.
Bullish and Bearish Scenarios
Bullish Scenario — Weekly Close Above $3.00
If NEAR completes the right shoulder and prints a sustained weekly close above $3.00 — the neckline — the inverse H&S pattern activates with a measured move target of approximately $6.00, representing ~145% upside from the neckline. CryptoBullet1 projects this breakout window opens in 2027, contingent on the right shoulder forming over the next several months.
Bearish Scenario — Loss of the Head’s Low (~$0.80)
Pattern invalidation occurs on a weekly close below the head’s low at approximately $0.80–$1.00. A close at that level would structurally negate the inverse H&S formation and suggest the accumulation thesis has failed. At current price of $2.453, that invalidation zone represents roughly ~67% downside — a scenario that would require significant macro deterioration or protocol-level negative catalysts to materialize.
Bottom Line
NEAR Protocol is tracing a multi-year inverse Head & Shoulders on the weekly chart — a formation that has been developing since March 2025 and currently shows the asset at $2.453, approximately 22% below the critical $3.00 neckline. Analyst CryptoBullet1 identifies the right shoulder as still forming, with a projected breakout window opening in 2027. If that neckline is cleared with a confirmed weekly close, the measured move targets ~$6.00 — roughly 145% above the breakout level.
The pattern is compelling in its construction but not yet confirmed — the entire thesis lives or dies on a sustained weekly close above $3.00. Watch that level as the sole confirmation trigger; without it, this remains an accumulation structure, not a trade.
Disclaimer: The views and analysis presented in this article are for informational purposes only and reflect the author’s perspective, not financial advice. Technical patterns and indicators discussed are subject to market volatility and may or may not yield anticipated results. Investors are advised to exercise caution, conduct independent research, and make decisions aligned with their individual risk tolerance.
Also Read: CFTC Ready to Issue Crypto Rules Despite Senate Clarity Act Failure