Can NEAR reclaim the $5.911 level, or does the slide run toward $2.848? NEAR enters November below its 50-day EMA, a price average that weights recent days most. The Near Price Prediction Nov
Can NEAR reclaim the $5.911 level, or does the slide run toward $2.848?
NEAR enters November below its 50-day EMA, a price average that weights recent days most. The Near Price Prediction November 2026 starts with buyers defending $3.691 support once. See theNEAR technical analysis today for the earlier view.
NEAR Market Snapshot and November Outlook
CoinGecko market data, captured 06:38 UTC, anchors the Near Price Prediction November 2026 at $3.912.
Metric
Value
Price
$3.912
Market cap
$5.14B
FDV
$5.14B
24h volume
$581.069M
Open interest
$1.667B
Source: CoinGecko, NEAR market snapshot, Nov 4, 2026, 06:38 UTC.
NEAR Pump.fun News and Catalyst
Pump.fun is a token trading app. Per theofficial NEAR Protocol X post, NEAR tokens are now live on it.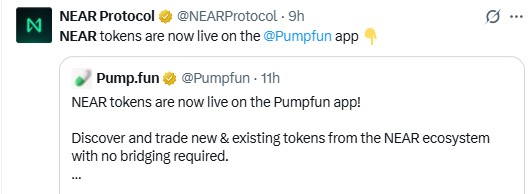
Source: NEAR Protocol official X account, Nov 4, 2026, 06:38 UTC.
The quoted Pump.fun post says traders can trade NEAR ecosystem tokens with no bridging required, meaning no cross-chain transfer.
If volume follows, the NEAR Pump.fun news adds a retail venue to the $581.069M 24h volume. Without that, the post stays a headline.
CoinGlass data, captured at 06:38 UTC, shows NEAR up 4.16% in 24 hours but down 19.98% over 30 days.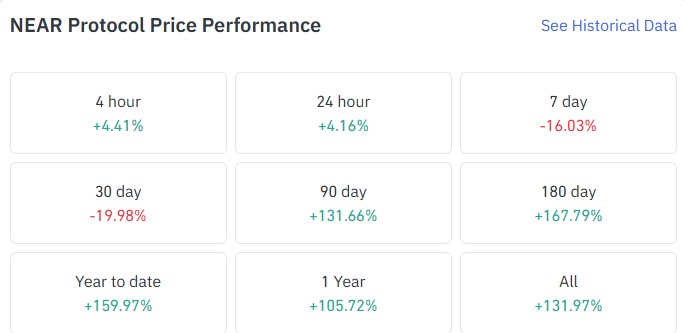
Source: CoinGlass, NEAR price performance, Nov 4, 2026, 06:38 UTC.
The 7-day move is down 16.03%, a small beside the 90-day gain of 131.66%. But sellers still lead the NEAR price forecast.
NEAR ETF Flows From the Bitwise NRR Fund
SoSoValue NEAR ETF data as of Nov 3, 2026, captured at 06:38 UTC, shows a $3.60M net outflow for the Bitwise NRR fund.
Source: SoSoValue, US NEAR spot ETF data, Nov 4, 2026, 06:38 UTC.
Cumulative net inflow stands at $81.22M. ETF net assets, the value of what the fund holds, are $60.87M. NRR trades at a 0.19% premium to its holdings.
One day of outflow isn't a trend, since cumulative ETF flows still sit positive. For wider context, see thelatest crypto market news.
NEAR Whale Wallets and Holder Concentration
Etherscan NEAR token holders data, captured at 06:38 UTC, covers only the Ethereum-listed NEAR token, worth $16.79M.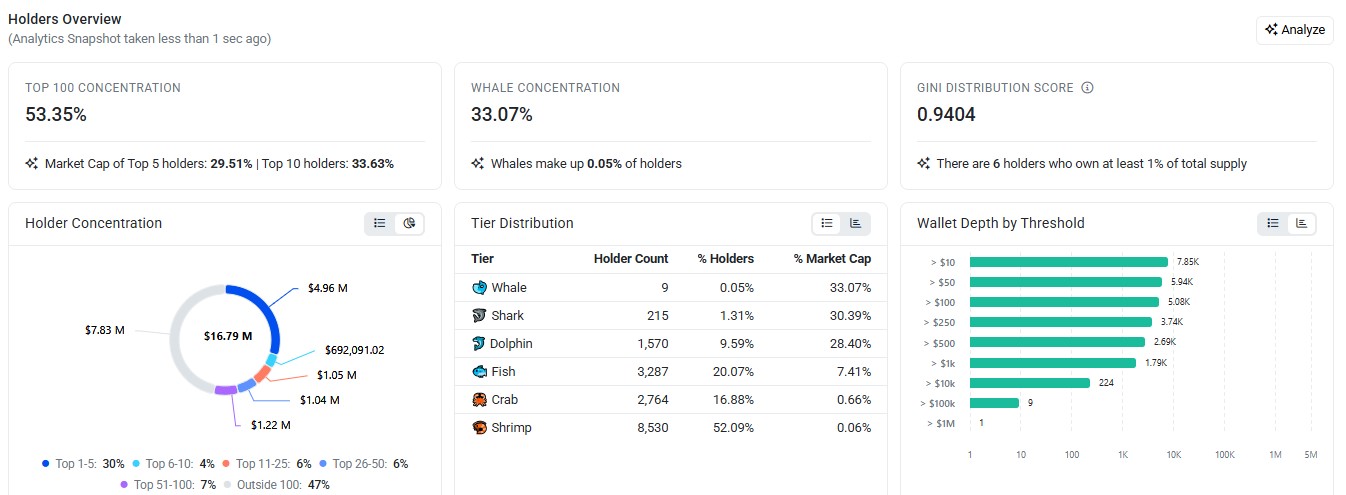
Source: Etherscan, NEAR token holders overview, Nov 4, 2026, 06:38 UTC.
The top 100 wallets hold 53.35% of that token. Whale wallets, the largest holders, number 9 and hold 33.07%.
Six wallets own at least 1% of supply. The largest, the Railgun Relay contract, holds 19.3436%.
NEAR Liquidation Data Shows Long Pain
Longs got hit hard. CoinGlass liquidation data, shows $3.11M wiped out in 24 hours.
Longs lost $2.23M and shorts $875.49K. Over the last 12 hours, Longs took the losses, with $1.46M against $552.15K.
Then the last hour flipped, with shorts losing $202.18K against $14.28K for longs. That's a short squeeze, forced buying by traders who bet on a drop.
NEAR Open Interest and Futures Volume
Open interest is the total value of futures contracts still open. CoinGecko lists NEAR perps open interest at $1.667B, captured 06:38 UTC.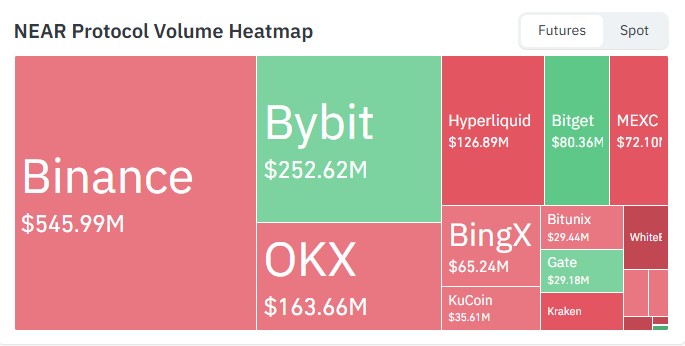
Source: CoinGlass, NEAR futures volume heatmap, Nov 4, 2026, 06:38 UTC.
CoinGlass NEAR futures data ranks Binance first at $545.99M. Bybit follows at $252.62M, a gap of $293.37M.
NEAR Technical Analysis: RSI and 50-Day EMA
The Binance 1D chart for NEAR/USDT on TradingView, captured at 06:38 UTC, frames this Near Price Prediction November 2026.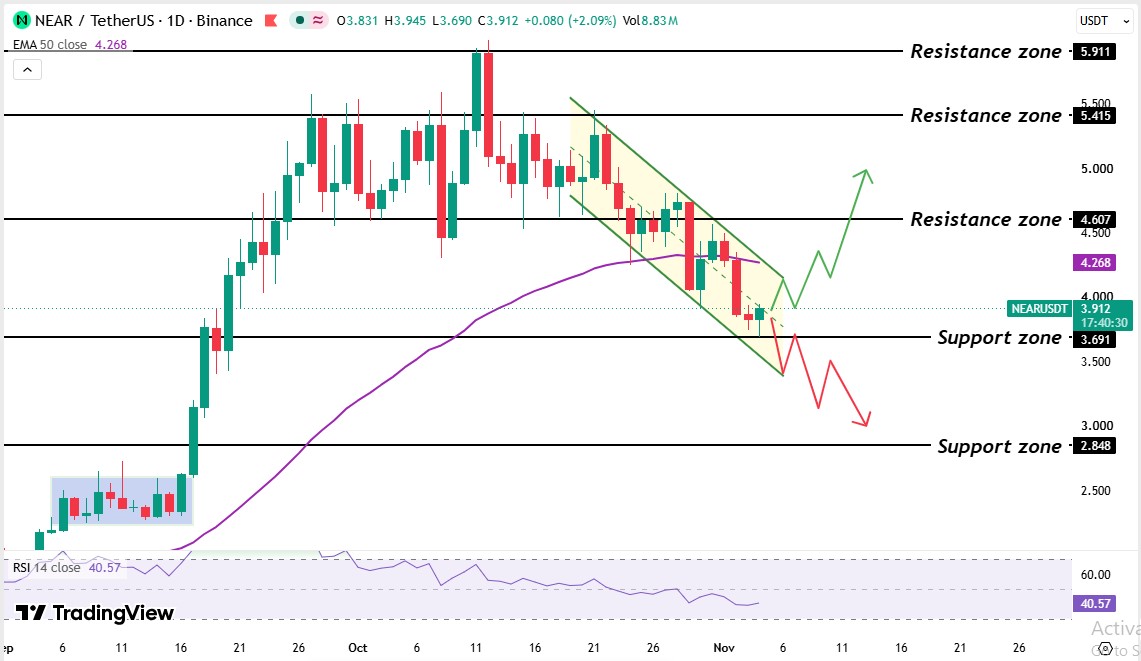
Source: TradingView, NEAR/USDT 1D, Nov 4, 2026, 06:38 UTC
NEAR did some consolidation in early September, then broke out of consolidation near 16 September. Through late September, the market tried many times to break the $5.415 resistance zone, but sellers defended it.
On 10 October the price broke the $5.415 level and tested the $5.911 level, but the price couldn't hold that level, and the price rejected that level.
From the third week of October, the price slid inside a falling channel, two falling parallel trendlines that hold price between a ceiling and a floor. A falling trendline, a line joining those highs, now caps NEAR price action.
Price lost the $4.607 resistance zone, then slipped under the $4.268 50 EMA, where sellers have taken over. The $3.691 support zone, where buyers have stepped in, held on to the latest candle.
Right now, the price trades above the $3.691 support zone, inside the falling channel
For the prior setup, see theNEAR floor breakdown analysis.
The NEAR 50-day EMA sits at $4.268. NEAR's $3.912 price trades 7.9% below it, and the latest daily candle trades below it too. And the channel ceiling sits near it.
The NEAR RSI reads 40.57 on the 14-day setting. Under 50, sellers hold the momentum edge. Above 30, oversold conditions haven't formed, so price has room to fall.
NEAR Support Levels and Resistance Levels
Level
Type
$2.848
Support
$3.691
Support
$4.268
50-day EMA
$4.607
Resistance
$5.415
Resistance
$5.911
Resistance
NEAR Bull, Base, and Bear Scenarios
Scenario
Trigger
Target
Invalidation
Bull
Daily candle trades above the $4.268 EMA level
$4.607 then $5.415
Trades below $3.691
Base
Holds $3.691 to $4.268
Range
Break of either level
Bear
Daily candle trades below $3.691
$2.848
Trades above $4.268
Regulatory delay, meaning slower approvals for more NEAR funds, keeps institutional demand thin. An ETF-flow reversal, meaning wider outflows from $3.60M, adds selling. Technical invalidation means a daily candle trading below $3.691.
NEAR Price Prediction November 2026: Expert Outlook
As per CoinGabbar analysis, the Near price prediction November 2026 leans cautious. RSI at 40.57 favors sellers. So does a $3.60M NRR outflow, with a price 7.9% below the EMA. But the floor held on the latest candle.
The daily 50-day EMA is the level to monitor. A daily candle trading above it turns the trend bullish, and a rejection there keeps sellers in control.
YMYL Disclaimer: This article is for informational and educational purposes only and should not be taken as financial or investment advice. Crypto markets are volatile