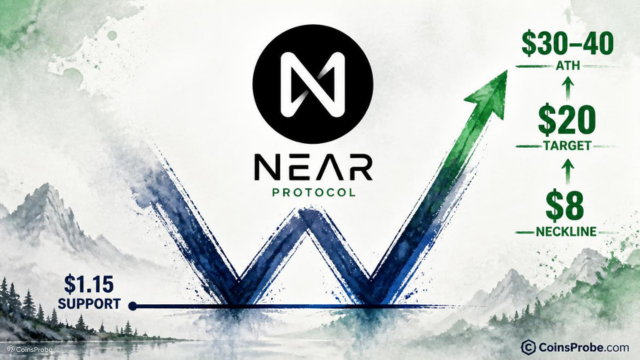
Key Highlights NEAR Protocol trading at $4.24 — forming a macro Double Bottom with $1.15 support tested twice across 2024 and 2026 Analyst @CryptoBullet1 targets $8 (neckline), $20 (measured
Key Highlights
NEAR Protocol trading at $4.24 — forming a macro Double Bottom with $1.15 support tested twice across 2024 and 2026
Analyst @CryptoBullet1 targets $8 (neckline), $20 (measured move), and $30–40 (speculative ATH) on weekly Binance chart
$8.00 weekly close is the sole confirmation trigger — NEAR is currently 89% below neckline
Pattern invalidation at $1.15 — a −73% decline from current price that would void the entire structure
NEAR Protocol is trading at approximately $4.24 on the weekly chart — sitting at the midpoint of what analyst @CryptoBullet1 identifies as one of the most significant macro chart structures in the current altcoin cycle: a giant Double Bottom forming across a multi-year base near $1.15. If the pattern confirms, NEAR’s measured move targets $20 — nearly 5x from current levels — with a speculative ATH scenario extending to $30–40.
The pattern was flagged by crypto analyst @CryptoBullet1, who stated directly: “$NEAR macro structure looks like a giant Double Bottom. If you’re holding $NEAR on spot your targets should be $8 & $20. $NEAR could even make a new ATH, something like $30–40.”
The analysis is built on NEAR/USDT weekly timeframe data from Binance, spanning price action from 2021 through to a projected 2027–2028 resolution window.
The Double Bottom — also called a W-pattern — is one of the highest-conviction bullish reversal structures in technical analysis. It requires two distinct price troughs at approximately the same level, separated by a recovery peak, with the implication that the second test of support was rejected, confirming buyer absorption at that zone.

NEAR Protocol Prints Macro Double Bottom — | Source: @CryptoBullet1 (X)
On NEAR’s weekly chart, the structure has formed across an extraordinary timeframe:
First bottom: Early 2024 — price reached approximately $1.15, a multi-year low following the broader altcoin collapse
Recovery peak (neckline): Approximately $8.00 — the dotted resistance line on the chart
Second bottom: Mid-2026 — price returned to retest $1.15, holding the identical support zone
Current position: $4.24 — recovering from the second trough, approximately 89% below the neckline
The critical mechanic: a Double Bottom is not confirmed until price closes decisively above the neckline on a weekly basis. That level, in NEAR’s case, is $8.00. Until that weekly close materialises, the pattern remains a setup — not a breakout.
The weekly NEAR/USDT chart shared by @CryptoBullet1 reveals the full scope of the macro structure. Blue curved lines trace the rounded recovery from each trough, illustrating the symmetry between the two bottoms. The horizontal black support line at $1.15 has acted as the pattern’s foundation across both tests — a level that held despite prolonged selling pressure in both 2024 and mid-2026.
The dotted resistance line at $8.00 marks the neckline — the prior recovery high between the two bottoms. This is the fulcrum of the entire setup. The chart projects a measured move target of $20, derived from the classic Double Bottom calculation: the distance from bottom to neckline ($1.15 to $8.00 = $6.85), extended upward from the breakout point ($8.00 + $6.85 ≈ $14.85 minimum, with $20 representing the analyst’s rounded projection accounting for momentum extension).
Beyond the measured move, @CryptoBullet1 flags the speculative ATH zone of $30–40 — territory that would require NEAR to exceed its prior all-time high and enter price discovery. NEAR’s previous ATH was approximately $20.44 (January 2022), making $20 a particularly significant structural level — the point at which prior distribution occurred during the last cycle peak.
Source: @CryptoBullet1 (X) | Chart: NEAR/USDT Weekly, Binance
The Double Bottom pattern produces a clear, binary analytical framework: everything hinges on $8.00. A sustained weekly close above that level transitions the pattern from hypothesis to confirmation. Below it, NEAR is still a recovery trade off a major low — not a confirmed breakout.
This specificity is what separates the @CryptoBullet1 analysis from generic bullish sentiment. It is not a call that “NEAR will go up” — it is a structural argument with a precise invalidation level ($1.15), a precise confirmation trigger ($8.00), a precise measured move target ($20), and a defined speculative extension ($30–40). Each level has a mechanical justification rooted in the pattern geometry.
The timeframe projection on the chart extends to 2027–2028 for full target realisation — a signal that this is not a short-term momentum trade. Spot holders, as @CryptoBullet1 explicitly notes, are the intended audience for this setup. The patience requirement is significant: from current levels, even reaching the neckline at $8.00 represents an 89% move.
For broader context on how multi-cycle macro patterns are playing out across leading assets, see our analysis on Bitcoin vs. Global M2: A Ratio That Has Called Every Cycle Top.
The technical setup does not exist in isolation. NEAR Protocol is a layer-1 blockchain with sharding architecture designed for high throughput and low transaction costs. Its relevance to the AI-crypto narrative — via the NEAR AI initiative — has kept it in institutional focus during 2025–2026. However, the @CryptoBullet1 analysis is purely structural: the Double Bottom argument rests on price geometry, not a specific protocol catalyst.
What the chart structure reflects is multi-year seller exhaustion at $1.15. Two separate tests of that level — spanning different market environments — failed to produce sustained downside. That repeated rejection is the empirical foundation of the bullish case.
Similarly, in other major layer-1 assets, breakout structures have preceded substantial moves — as seen in our coverage of Ethereum breaking $2,560 with analysts eyeing $2,760. Pattern confirmation, not the pattern itself, is what drives price.
Bullish Scenario — Weekly Close Above $8.00
A sustained weekly close above $8.00 confirms the Double Bottom neckline breakout. The measured move target activates at $20 — a +372% move from current levels. If NEAR enters price discovery above the prior $20.44 ATH, the speculative extension to $30–40 becomes the operative target — representing +608% to +843% from $4.24. Timeframe: 2027–2028 based on the chart projection.
Bearish Scenario — Loss of $1.15
A weekly close below $1.15 — the Double Bottom support — invalidates the pattern entirely. This would represent a −73% decline from current levels and would indicate that the support zone has failed its second test, opening the possibility of a sustained breakdown with no defined structural floor from this pattern framework. The Double Bottom thesis would need to be abandoned.
What it says: NEAR has formed a two-year macro Double Bottom at $1.15 with a neckline at $8.00. If that neckline breaks on a weekly close, the measured move targets $20, with speculative extension to $30–40.
What it doesn’t say: It does not confirm that the breakout will happen, or that $8.00 will be reached on any defined timeline. The pattern is a setup, not a guarantee. NEAR remains 89% below neckline confirmation at the time of writing.
What to watch for continuation: Weekly candle closes — specifically whether price can reclaim and hold above $5.50–$6.00 as an intermediate zone, then build momentum toward the $8.00 neckline. Volume on the weekly timeframe should expand as price approaches $8.00 for genuine breakout confirmation. Also watch Bitcoin’s broader macro structure, as altcoin pattern resolutions remain correlated — see Bitcoin’s 14-Indicator Heatmap Turns Green for the macro context.
Bottom Line
NEAR Protocol is sitting at $4.24 — the midpoint of a macro Double Bottom structure that analyst @CryptoBullet1 has identified on the weekly NEAR/USDT Binance chart. The pattern’s foundation is a $1.15 support level that survived two independent multi-year tests, in early 2024 and mid-2026. The neckline at $8.00 is the sole confirmation trigger: a decisive weekly close above that level activates a measured move to $20 (+372%) with a speculative ATH extension to $30–40 (+608%–+843%).
The pattern’s invalidation sits at $1.15 — a −73% decline from current price. Until $8.00 breaks with weekly conviction, this remains one of the most structurally significant setups in the altcoin market — unconfirmed, but intact. Watch the weekly close at $8.00 as the single level that either validates or defers this entire thesis.
Disclaimer: The views and analysis presented in this article are for informational purposes only and reflect the author’s perspective, not financial advice. Technical patterns and indicators discussed are subject to market volatility and may or may not yield anticipated results. Investors are advised to exercise caution, conduct independent research, and make decisions aligned with their individual risk tolerance.