The Official Trump token just surged in one of its most aggressive single-day moves of 2026, with $8 million in positions wiped out, volume exploding past $910 million, and the chart showing
The Official Trump token just surged in one of its most aggressive single-day moves of 2026, with $8 million in positions wiped out, volume exploding past $910 million, and the chart showing a clean break above structure.
This breakdown covers the technicals, the news trigger, the liquidation data, and what traders should be watching next.
Why Is $TRUMP Pumping Hard Right Now?
The Official Trump price prediction story today starts with news, not a chart pattern. A positive development between the USA and Iran hit the market yesterday, and $TRUMP was one of the fastest tokens to react.
That kind of event-driven move is different from regular price action. Traders who were short got caught off guard, and that forced a chain of liquidations that pushed the price even higher.
Official Trump Coin Overview: What You Need to Know
Detail
Data
Coin Name
Official Trump
Ticker Symbol
TRUMP
Blockchain
Solana
Today High
$2.36
Today Low
$1.75
RSI Level
71.62
Token Type
Meme / Political
Market Cap
$521.83M
24H Trading Volume
$910M+
Circulating Supply
237.41M TRUMP
Total Supply
999.99M TRUMP
Fully Diluted Valuation
$2.19B
24H Change
+25.22%
Source: Data by CoinMarketCap
Why TRUMP Is Getting Attention Beyond the Regular Crowd
The Iran-USA deal news was the match. But the fuel was already there: a massive rotation into altcoins had been building, with several smaller tokens posting double-digit gains in the days before.
Basically, risk appetite was returning to the market. $TRUMP happened to be in the right place when the news dropped. Volume on Binance alone hit $750.83M, which confirms this wasn't just a few traders chasing candles.
TRUMP Liquidation Data: $8 Million Wiped in 24 Hours
This is the part of the story most articles skip.
Official $TRUMP Liquidation Breakdown
Window
Total Liquidated
Longs
Shorts
1 Hour
$143.63K
$87.38K
$56.25K
4 Hours
$898.61K
$646.59K
$252.01K
12 Hours
$3.87M
$1.63M
$2.24M
24 Hours
$8.03M
$3.50M
$4.53M
Source: Data by the CoinGlass
Shorts took the bigger hit in the 12-hour and 24-hour windows. $4.53M in short positions got erased in a single day.
TRUMP Chart Breakdown: Channel Snapped, EMA Cleared
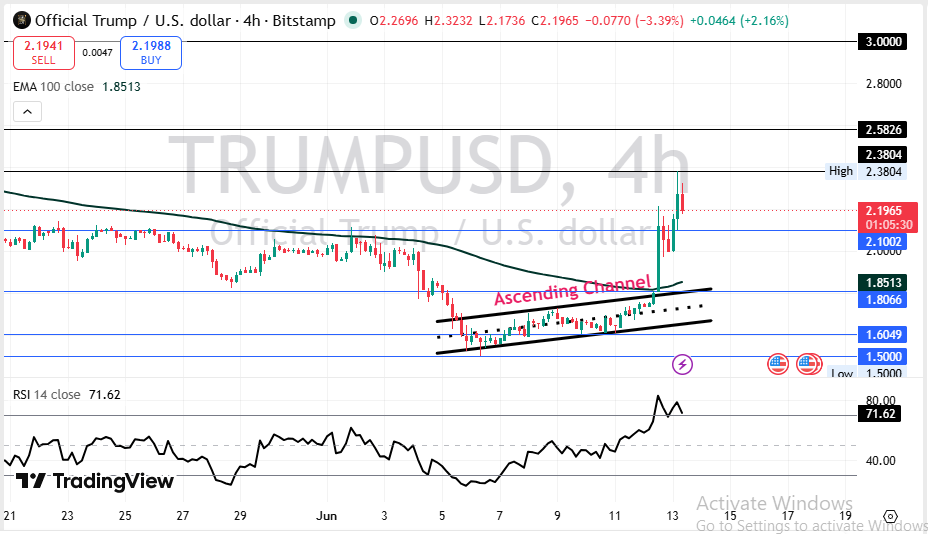
The chart tells a clean story. $TRUMP had been grinding inside an ascending channel since early June, slowly building support.
Source: Charting by TradingView
Then it broke out. Hard.
Price blasted above the 100 EMA at $1.8513, the channel upper boundary, and pushed as high as $2.38 in a single session. That's not a slow grind. That's a flush followed by a squeeze.
RSI hit 71.62 on the 4-hour chart. That's technically overbought territory, but in a news-driven event move, RSI staying elevated isn't unusual. The key question is whether it can hold above $2.10 on a closing basis.
The volume heatmap shows Binance leading with $750.83M, OKX at $532.39M, and Bybit at $208.51M. That's widespread participation. Not one exchange carrying it.
Short-Term Official Trump Price Prediction for June 2026
The price is above the 100 EMA, but the RSI is stretched. A short pullback before the next leg is the most realistic path, but the news catalyst keeps the bulls in control for now.
Timeframe
Bearish Target
Base Target
Bullish Target
Key Trigger
24 Hours
$1.95
$2.15
$2.38
Hold above $2.10 EMA zone
3-7 Days
$1.80
$2.25
$2.58
Volume sustains above $500M daily
2-4 Weeks
$1.60
$2.10
$2.80
No negative political news; altcoin season holds
RSI needs to cool before another push. Watch the $2.10 level closely.
Long-Term Official Trump Price Prediction for 2026 and 2027
The macro setup for altcoins is improving, but TRUMP's long-term fate is tied to Trump-related news cycles and broader meme coin appetite. It's still down 97% from its all-time high, and that context matters.
Timeframe
Bearish Target
Base Target
Bullish Target
Catalyst Needed
3 Months
$1.20
$2.40
$3.50
Altcoin season continuation, positive political news
6 Months
$0.90
$2.80
$4.50
Bull cycle acceleration, Trump in major headlines
End of Year
$0.75
$3.20
$6.00
Full bull market with meme coin rotation
2027 Outlook
$0.50
$2.50
$8.00
New ATH cycle, strong political narrative revival
The long-term case is speculative, not strong. It's entirely sentiment-driven.
Three Scenarios That Could Play Out for TRUMP
Worst Case:Political sentiment flips negative or the broader market rolls over. TRUMP falls back below $1.50 and retests the all-time low zone near $1.21.
Base Case:Altcoin rotation holds, $TRUMP consolidates between $2.00 and $2.40, and slowly grinds higher through Q3. No dramatic move, but no collapse either.
Best Case:Another major Trump-related news event drops, RSI resets, and fresh volume pushes TRUMP toward the $3.00 resistance. Short sellers get squeezed again.
Scenario
Price Range
What Triggers It
Worst Case
$0.75 to $1.50
Market downturn, negative news
Base Case
$2.00 to $2.58
Stable altcoin rotation
Best Case
$2.80 to $3.50
Major political news catalyst
Key Price Levels Every TRUMP Trader Should Watch
Resistance Zones:
$2.3804: Immediate resistance, the recent session high. This is the first wall bulls need to clear.
$2.5826: Mid-level resistance from the prior structure. Clearing this opens the door to $3.
$3.0000: Major psychological and technical ceiling. A weekly close above here would change the entire picture.
Support Zones:
$2.1002: Immediate support. Holding this keeps bulls in control intraday.
$1.8066: Key structural support, close to the 100 EMA. Losing this flips short-term momentum.
$1.6049: Next major floor if $1.80 breaks. This is the last line before the $1.50 zone.
Invalidation Zone:
What Analysts Are Watching About TRUMP Right Now
When we pulled up the 4-hour chart, the first thing that stood out was how clean the breakout looked. The price wasn't grinding up. It was vertical.
That kind of move almost always starts with a forced exit: people short the channel, the news hits, and the squeeze begins. $4.53M in shorts gone in 24 hours confirms exactly that.
But here's what most traders are missing: the RSI at 71.62 doesn't mean the move is over. It means the next few candles will tell you whether this has legs or not. A healthy pullback to the $2.10 area that holds would actually be a positive signal.
And that raises a bigger question: does $TRUMP have the fundamental backing to stay elevated, or does it fade the moment the news cycle moves on? The token is still down 97% from its ATH.
One external factor to watch: broader altcoin rotation. If Ethereum and Solana continue attracting capital, meme coins tend to follow. But if BTC dominance rises again, tokens like TRUMP are usually the first to give back gains.
The most important level to hold is $2.10. That's the line between a breakout and a bounce.
Don't mistake a 25% candle for a trend shift until the weekly close confirms it.
Disclaimer
This article is for educational purposes only and does not constitute financial advice. Crypto markets are volatile. Consult your investment advisor before making any investment decision.