A token most people had never heard of is suddenly showing up on watchlists everywhere. Key Takeaways Direction: Short-term momentum is up, but the setup is still undecided Reason: A sharp vo
A token most people had never heard of is suddenly showing up on watchlists everywhere.
Key Takeaways
Direction: Short-term momentum is up, but the setup is still undecided
Reason: A sharp volume spike and a tightening chart pattern are pulling in new buyers
Short-term range: Roughly $0.0164 to $0.0288 over the next week
Invalidation: A weekly close below $0.01477 would flip the outlook bearish
Why Is Everyone Suddenly Talking About This Small Base Network Coin?
OWB price prediction discussions have picked up fast this week, and it's not hard to see why. The token jumped sharply in a single day, and that kind of move tends to pull in attention whether people were watching it before or not.
What makes this one interesting isn't just the candle. It's the setup building underneath it.
Trading volume spiked in a way that stood out even against a busy crypto week. Turns out, a lot of that interest came after the coin started showing up acrossblockchain crypto news feeds following a steep run-off of its recent lows.
So what happens after a move like this? Does it hold, or does it fade the way so many quick pumps do?
OWB Coin Overview: Key Numbers Traders Are Checking Right Now
MetricDataCoin NameOWBTicker SymbolOWBBlockchainBaseContract Address0xEF5997c2cf2f6c138196f8A6203afc335206b3c1Today High$0.03116Today Low$0.01136RSI Level54.42Token TypeUtility / GamingToken CategoryGamingMarket Cap$10.14M24H Trading Volume$799.34K24H Trading Volume Change+959.17%Circulating Supply455.13M OWB24H Change+48.02%
Source: Data by CoinMarketCap
What Is OWB and Why Does a Gaming Token Run on Base?
OWB is a gaming-linked token built on Base, Coinbase's layer-2 network, and it trades against USDC on the Aerodrome exchange. The project runs under the Clash of Coins banner, according to theOWB token contract listed on BaseScan. As per BaseScan, the token has a fixed max supply of one billion OWB and is currently held by roughly 86,000 wallets.
Why This Coin Matters Right Now Beyond the Chart Move
The bigger story isn't just price. It's a supply. According to CoinMarketCap, only 455.13M of the 1 billion total supply is in circulation, which leaves a large chunk still to enter the market over time, a pattern common amongtop memecoins and other low-cap tokens.
That matters because unlock schedules and future supply almost always shape how sustainable a rally turns out to be. Basically, a good chart with a shaky supply story is still a shaky story.
Whale Concentration Data Every OWB Holder Should See First
Here's the thing that stood out the most when we pulled up the on-chain data: this token is heavily concentrated. According to BaseScan analytics, the top 100 wallets control 87.32% of supply, and whale wallets alone account for 95.84% of the circulating market cap while making up just 0.54% of holders.
Just three wallets combined hold more than 60% of the total supply. That's not a small detail; it's close to the whole picture.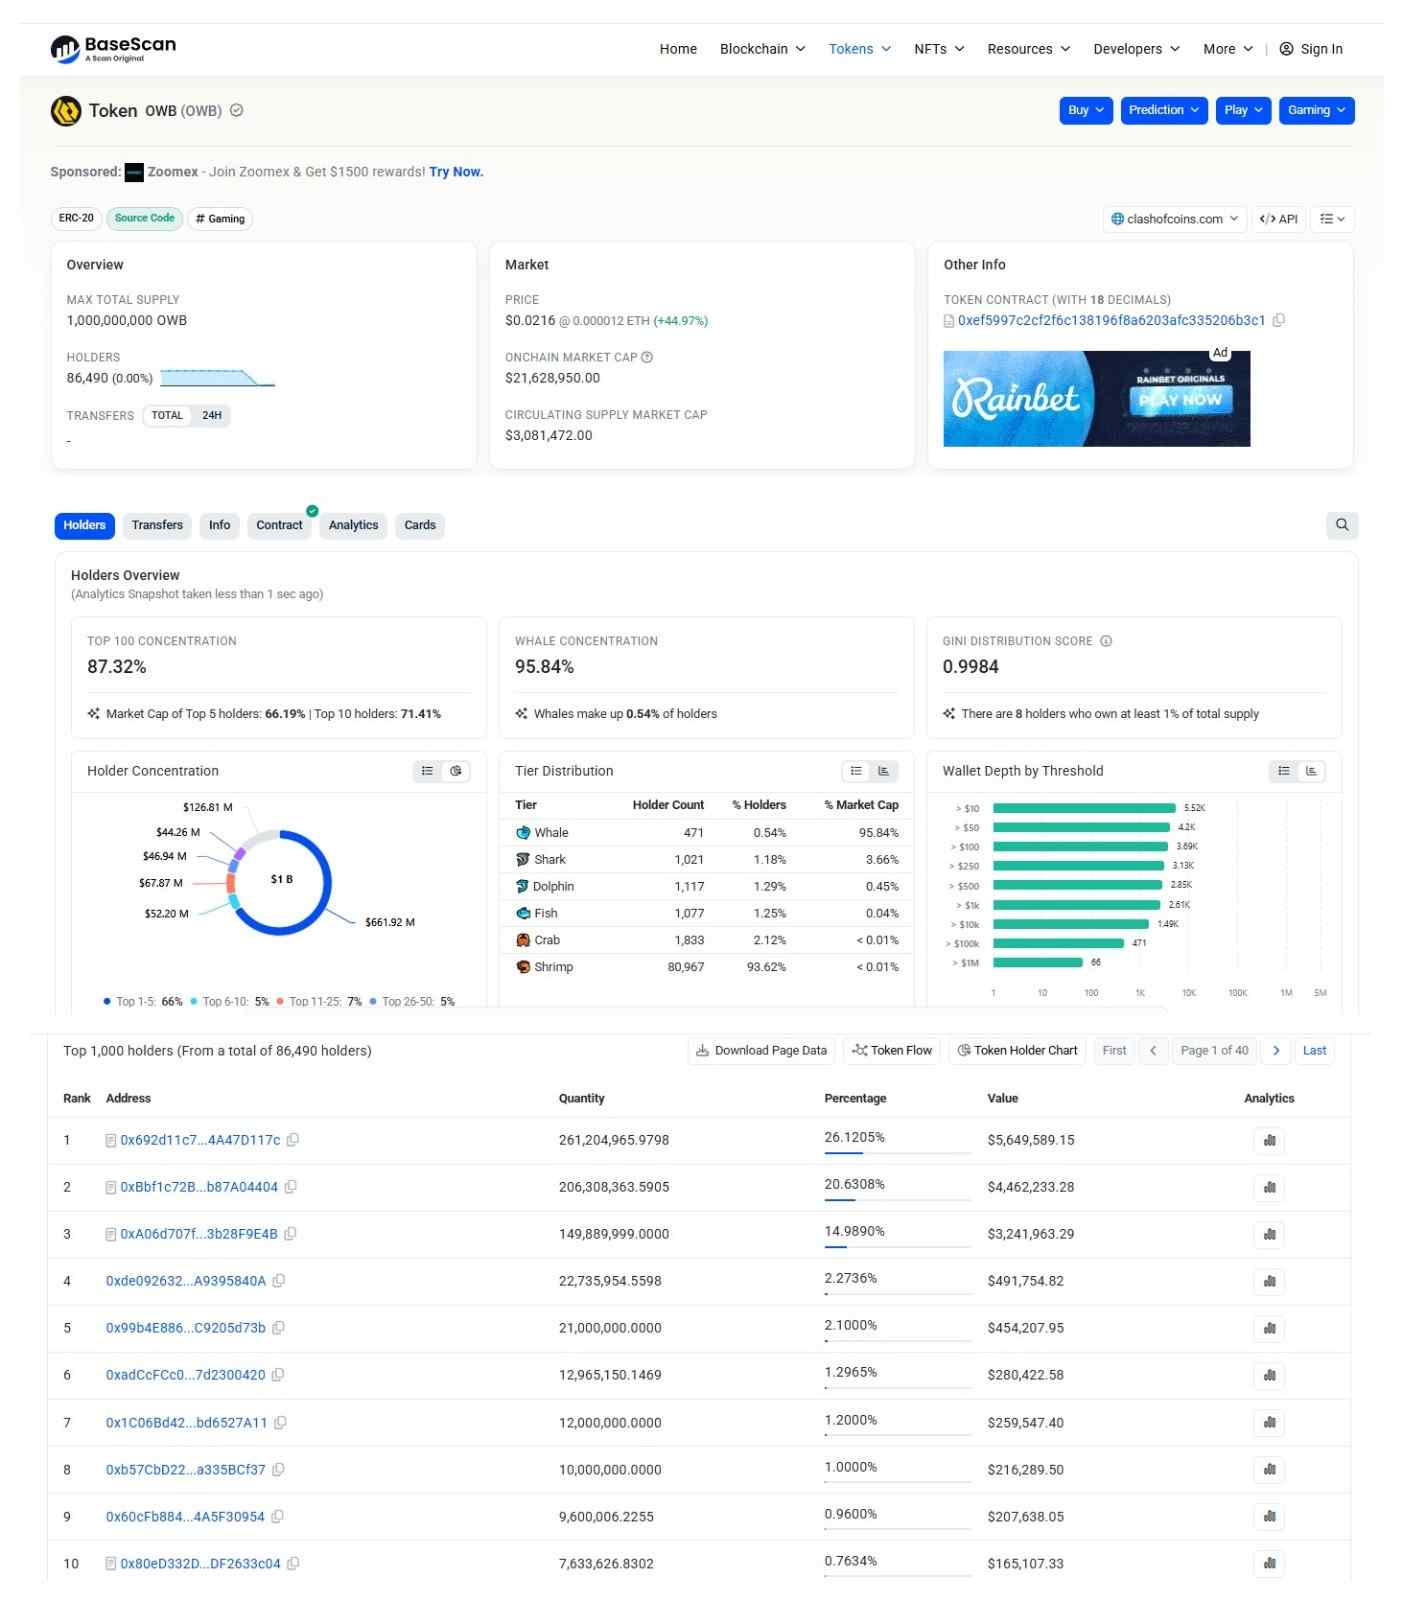
Source: Holder data by BaseScan
OWB Technical Analysis: Price Coils Inside a Symmetrical Triangle
Price is consolidating right after a sharp rally, and that pause is the real story here, not just the candle that got everyone's attention. According toTradingView chart data, OWB is trading around $0.0226 on the 1-hour timeframe, sitting inside a symmetrical triangle pattern that has been tightening since the breakout candle.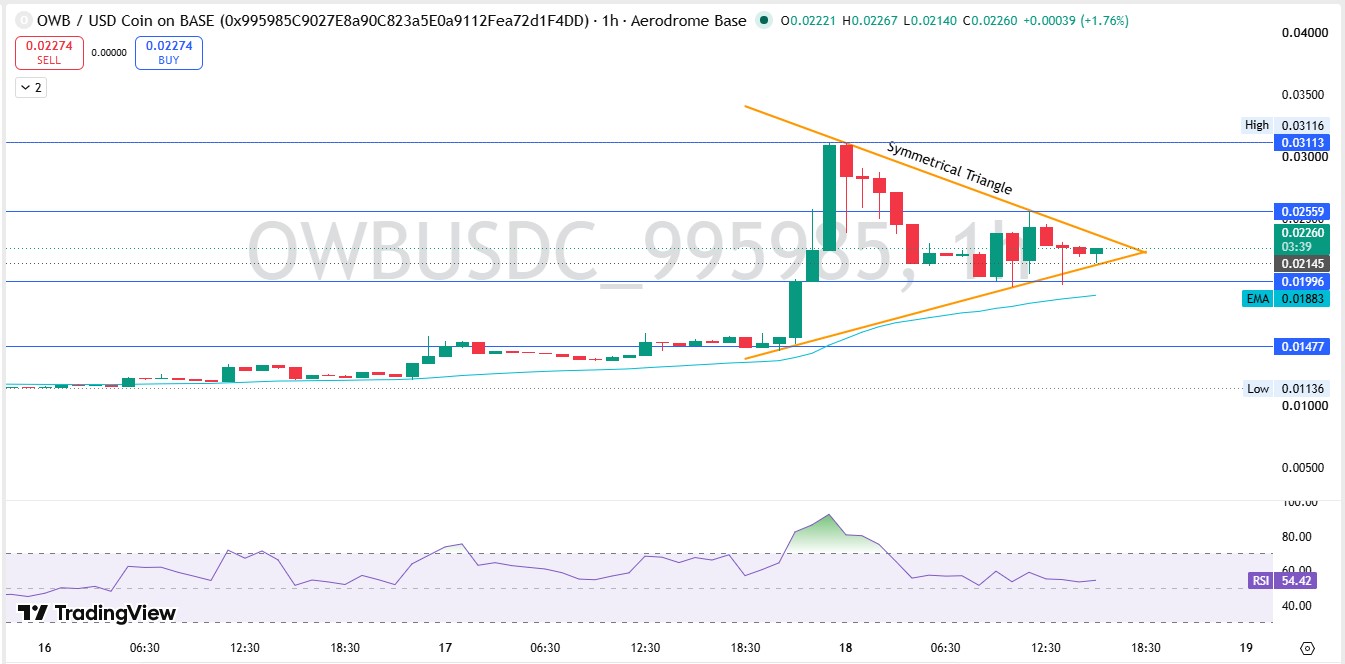
Source: Charts by TradingView
The price is holding above the 50 EMA at $0.01883, which keeps the short-term trend tilted in favor of buyers. RSI sits at 54.42, a neutral reading that leaves room to move in either direction without flashing overbought or oversold yet.
Key resistance sits at $0.02559 and then $0.03113. Support sits at $0.01996, backed by a deeper floor near $0.01477. A close above the triangle's upper edge on rising volume would favor continuation. A break below $0.01996 would put that entire structure at risk.
OWB vs Other Base Network Gaming Tokens
Compared to most low-cap gaming tokens on Base, which sits inside the widerEthereum ecosystem as a layer-2 network, OWB's 24-hour volume-to-market-cap ratio of 8.06% is unusually high, pointing to short-term speculative interest rather than steady accumulation. Liquidity-to-market cap sits near 2.06%, which is thin and can add to price swings in both directions.
Short-Term OWB Price Prediction: Where the Chart Points Next
The next few days likely hinge on whether price can clear the triangle's resistance on real volume, not just a wick, a setup worth tracking alongside othercrypto price predictions this week.
TimeframeBearish LevelBearish TargetPivot / Base LevelBase TargetBullish LevelBullish TargetInvalidation24 HoursKey Support$0.01996Base Support$0.0220550 EMA Break$0.02559Break below Key Support3–7 DaysLower Support$0.01636Key Pivot Zone$0.02288Key Resistance$0.02878Lose Lower Support2–4 WeeksMajor Support$0.01477Key Resistance$0.02878Major Resistance$0.03293Weekly close below Major Support
Source: TradingView (1H) | Pivot Points | EMA 50 | Market Structure
Watch volume on any move toward $0.02559. Without it, the breakout probably doesn't stick.
Long-Term OWB Price Prediction: What Would Actually Sustain This
Longer term, the story stops being about candles and starts being about whether real demand shows up to absorb the rest of that billion-token supply, much like the debate playing out in the currentBitcoin price outlook.
TimeframeBearish LevelBearish TargetBase LevelBase TargetBullish LevelBullish TargetCatalyst Needed3 MonthsWeekly Support$0.010Weekly EMA 50$0.019Weekly Pivot$0.032Holding weekly support with steady volume6 MonthsRange Low$0.007Key Resistance Zone$0.028Major Resistance$0.045Ecosystem growth, active gaming user baseEnd of YearMacro Support$0.005Major Resistance$0.040Major Breakout Zone$0.060Broader token unlock absorbed without dumping2027 OutlookMacro Support$0.003Major Resistance$0.055New Extension Zone$0.090Sustained adoption plus a healthier holder base
Source: TradingView (Weekly) | Pivot Points | Macro Trend Analysis
The honest take: the long-term case is fragile until supply concentration improves. A chart pattern can't fix a distribution problem on its own.
Three OWB Price Scenarios Traders Should Prepare For
Worst Case:A large wallet exits and drags the price through $0.01477. Thin liquidity accelerates the drop.
Base Case:Price stays range-bound between $0.017 and $0.029 while the triangle resolves slowly, mirroring broaderaltcoin market trends.
Best Case:Volume returns, whales stay passive, and price clears $0.02878 with follow-through buying.
ScenarioPrice RangeWhat Triggers ItWorst Case$0.005 – $0.015Whale sell-off, liquidity dries upBase Case$0.017 – $0.029Sideways consolidation continuesBest Case$0.029 – $0.045Breakout confirmed on strong volume
Key OWB Price Levels to Watch This Week
Resistance zone: $0.02559, then $0.03113. A close above both on volume opens room toward the triangle's upper measured target, a rejection pattern similar to the recentXRP price prediction setup near resistance.
Support zone:$0.01996, backed by $0.01477. Buyers have defended this area on recent pullbacks.
Invalidation zone:Below $0.01477. A weekly close under this level breaks the current bullish structure completely.
Analyst View and Final Thoughts on the OWB Setup
When we pulled up the RSI, the first thing that stood out was how neutral it still is for a coin that just moved nearly 50% in a day. That's unusual. It means the rally hasn't exhausted itself yet, but it also hasn't confirmed anything.
The triangle pattern is the real tell here. Triangles this tight after a sharp move tend to resolve fast, one way or the other.
But price alone doesn't answer the bigger question. And that's exactly the problem: supply concentrations this extreme rarely end quietly.
One external factor worth tracking beyond the chart is how much of the remaining locked supply eventually reaches crypto exchanges and how it gets distributed when it does.
The most important level right now is $0.01996. Hold it, and the bullish case stays alive. Lose it, and this turns into a very different conversation.
That's the setup as it stands today.
OWB Risk Factors: What Could Break This Thesis
Liquidity risk:Liq./Mkt. cap sits near 2.06%, thin enough for large orders to move price sharply.
Concentration risk:Whale wallets control over 95% of market cap, according to BaseScan, raising sell-pressure risk at any time.
Volatility risk:A 24-hour range from $0.01433 to $0.03102 shows how fast this token can swing either direction.
For broader context on how the wider market is trading right now, readers can also check recentBitcoin price coverage, since large-cap moves often set the tone for smaller base-network tokens like this one.
Disclaimer: This article is for educational purposes only and does not constitute financial advice. Crypto markets are volatile. Consult your investment advisor before making any investment decision.