Solana is trading near $111.62, up about 2% in the last 24 hours. The price has cooled from its recent push toward $130 and now sits on a key support zone. News is landing at the same time. A
Solana is trading near $111.62, up about 2% in the last 24 hours. The price has cooled from its recent push toward $130 and now sits on a key support zone.
News is landing at the same time. A second spot SOL ETF is about to list in Hong Kong. The chain also reclaimed the top spot in tokenized equities trading.
So the big question is simple. Can SOL hold $110?
What Is the Solana Price Today?
SOL is priced at $111.62, a gain of $2.19 on the day. Here are the main numbers.
Metric
Value
Price
$111.62
24h change
+2%
Market cap
$65.65B
Spot volume (24h)
$497.38M
Futures volume (24h)
$5.64B
Open interest
$7.10B
Circulating supply
589.10M SOL
Total supply
635.65M SOL
Look at the gap between spot and futures volume. Futures trading is about 11 times larger than spot. Most of the action is in derivatives.
What Is the SOL ETF in Hong Kong?
Hong Kong is getting its second spot SOL ETF. Pando's ETF (2831.HK) is set to list on HKEX on 13 October.
Reports say it gives direct SOL exposure through licensed platforms. It has no staking or leverage.
Globally, spot SOL ETFs hold $1.9B in net assets. Cumulative net inflows stand at $1.61B.
The listing fits Hong Kong's push to become a crypto investment hub. Easier access could draw both retail and institutional buyers, though that is not guaranteed.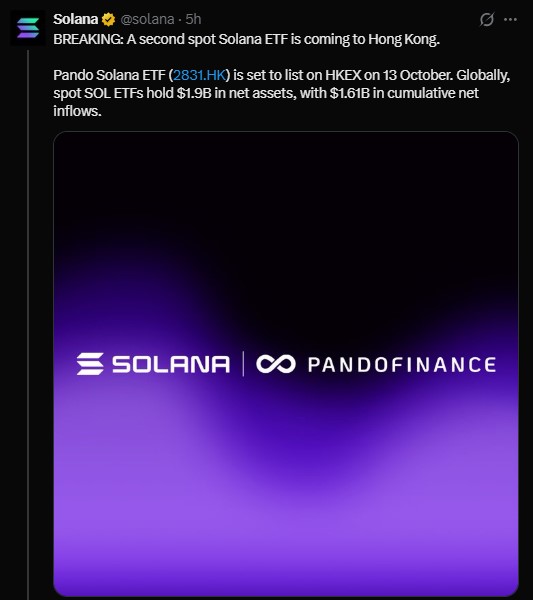
Is SOL Now the Top Chain for Tokenized Equities?
Yes, on the latest data. A chart shared on X shows the network at 58% of daily tokenized equities spot volume on 11 October 2026. All other chains together had 42%.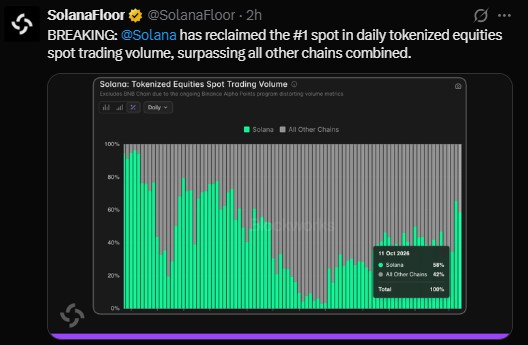
The chart leaves out BNB Chain because the ongoing Binance Alpha Points program is said to distort volume there. The share has also swung a lot over time, so one day does not make a trend.
Analysts also point to stablecoin payments and institutional services as growth areas for the network. These themes support the story, but they do not set the price on their own.
Is SOL Derivatives Data Bullish or Bearish?
Mixed. Futures volume jumped 93.14% to $5.65B, and open interest rose 3.93% to $7.10B.
Derivatives metric
Value
Change
Futures volume
$5.65B
+93.14%
Open interest
$7.10B
+3.93%
Options volume
$18.37M
+57.92%
Options open interest
$101.22M
+5.75%
The overall 24-hour long/short ratio is 0.9627. Below 1 means slightly more shorts than longs.
Exchange data looks different. More accounts are long on Binance and OKX. Account ratios count traders, not position size, so the readings can differ.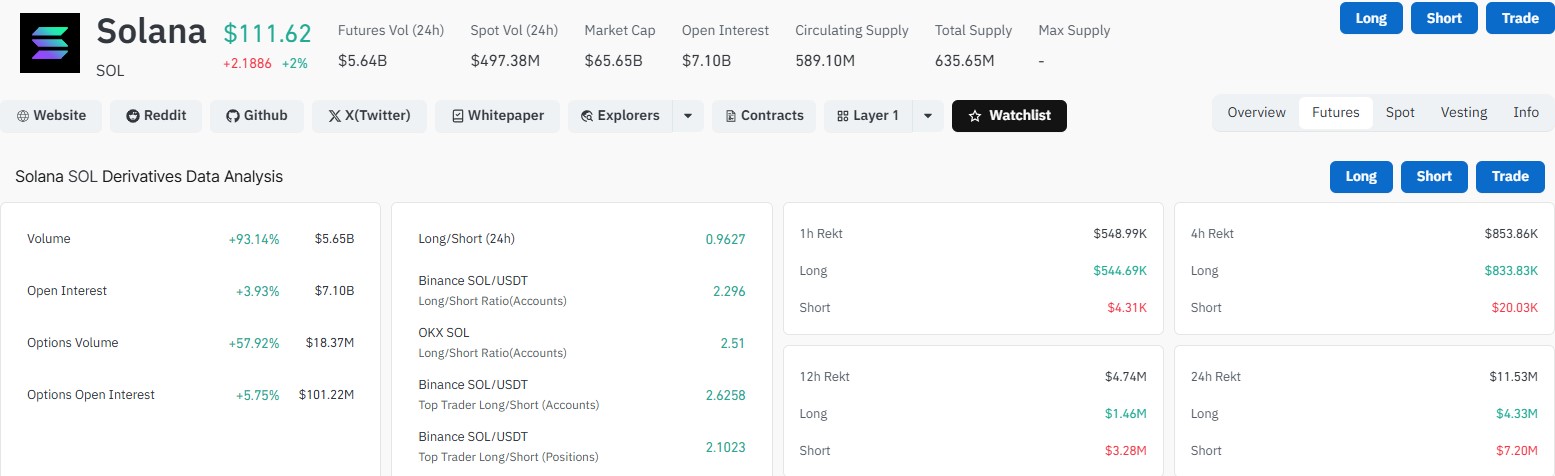
Long/short ratio
Reading
Binance SOL/USDT (accounts)
2.296
OKX SOL (accounts)
2.51
Binance top traders (accounts)
2.6258
Binance top traders (positions)
2.1023
How Much SOL Was Liquidated Today?
Liquidations show where traders were caught on the wrong side.
Period
Total
Long
Short
1 hour
$548.99K
$544.69K
$4.31K
4 hours
$853.86K
$833.83K
$20.03K
12 hours
$4.74M
$1.46M
$3.28M
24 hours
$11.53M
$4.33M
$7.20M
Over 12 and 24 hours, short sellers lost more. In the last hour and four hours, almost all losses came from longs.
That fits the recent dip. Buyers took the hit as price slid toward $110.
What Are the SOL Support and Resistance Levels?
Level
Role
$145 to $150
Major supply zone
$125 to $130
Upside target and recent rally area
$120
Nearby resistance
$110 to $112
Current support
$97 to $100
Moving-average region if $110 breaks
RSI sits below the neutral 50 mark. That suggests bullish momentum has cooled. A move back above 50 would help buyers.
Will Solana Go Up or Down?
Nobody can say for sure, but the setup is fairly clear.
If buyers defend $110 to $112 and reclaim $120, SOL could try another move toward $125 to $130. The ETF and equities news may help sentiment. They do not guarantee demand.
If SOL breaks below $110 and stays there, the setup weakens. The $97 to $100 area would come into focus.
Further out, $145 to $150 is a big supply zone where sellers could show up. SOL needs to rebuild momentum and clear smaller hurdles first.
The next signal is simple. Can buyers hold $110 and push back above $120? Until then, the chart can lean either way.
Disclaimer
This article is for information only. It is not financial, investment, or trading advice. Crypto prices are volatile, and you can lose money. Price levels and forecasts are not guaranteed. Do your own research and speak with a licensed financial adviser before you invest.