Pepe price has climbed more than 70% over the past 4 days, taking PEPE back to price levels that seemed distant only a few sessions ago. The meme coin reached its highest price since May toda
Pepe price has climbed more than 70% over the past 4 days, taking PEPE back to price levels that seemed distant only a few sessions ago. The meme coin reached its highest price since May today, but the latest move has now run into an important test.
PEPE touched the $0.0000455 area during the latest market recovery. That zone is particularly important because it is close to levels reached during February, when Pepe price traded near $0.000050.
The question now is whether PEPE can push through this resistance or whether the latest rejection marks the start of a deeper pullback. Several factors behind the rally remain active, although the technical indicators show that the price has already moved into an overheated area.
Pepe price did not climb more than 70% without help from the broader crypto market. Bitcoin moved above $70,000 after developments around US regulation and Treasury buybacks helped improve conditions across major crypto assets.
Meme coins benefited heavily from that recovery. PEPE was particularly responsive as capital moved toward higher risk crypto assets during the market rebound.
Whale activity also played an important role. Santiment data showed multiple PEPE transactions worth more than $1 million each. Large holders also moved more than 1.45 trillion PEPE away from centralized exchanges and into self custody wallets.
Large exchange outflows can reduce the amount of PEPE immediately available for sale. Strong demand can therefore have a greater effect on Pepe price when liquid exchange supply falls.
Derivatives activity provided another factor behind the rally. Short positions came under pressure as PEPE moved higher, which helped accelerate the move as bearish positions were forced out of the market.
Pepe Price Reaches 3 Month High but Faces Strong Resistance Near $0.000045
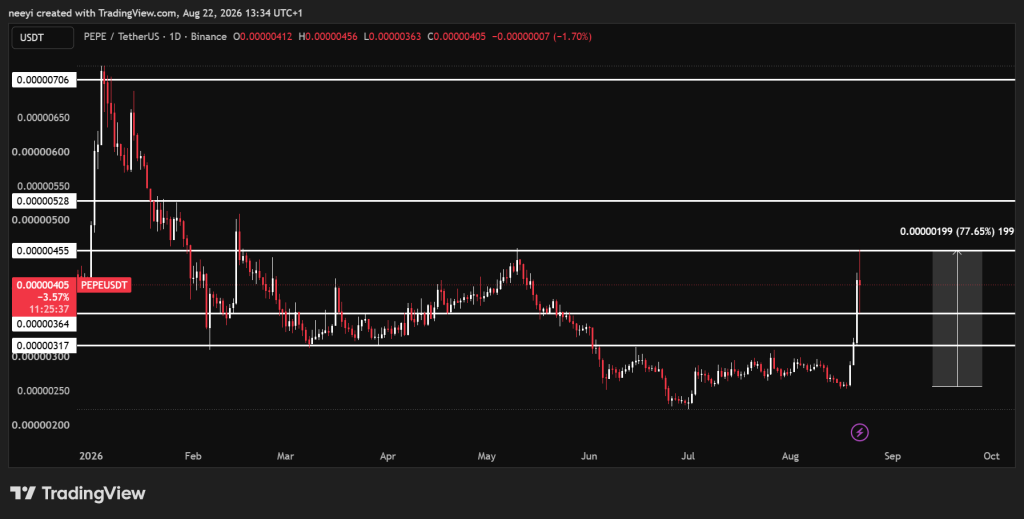
A look at the PEPE chart shows why the current area deserves close attention. Pepe price reached approximately $0.0000455 today, its highest level since May and close to some of the highest prices recorded during February.
The February high near $0.000050 now creates an important reference point for the next move.
PEPE has already pulled back after reaching the $0.000045 area. The latest 4 hour candle has also turned bearish, which shows that buyers have struggled to clear the resistance on the first attempt.
That rejection does not necessarily mean the 4 day rally has ended. PEPE’s move has developed alongside a much broader crypto market recovery. Continued strength across Bitcoin and other major assets could give Pepe price another chance to challenge the same resistance.
PEPE Price Chart / TradingView.com
A clean break above $0.000045 could put $0.000050 back into focus. Continued market strength could eventually open a path toward $0.000070, although PEPE would need to clear several resistance areas before reaching that level.
Read Also: Bitcoin Price Rally Turns Historic as BTC Moves 140 Times FASTER Than the Stock Market
Pepe Price Support at $0.0000364 Could Decide Whether the Rally Holds
PEPE’s downside levels have become equally important after the rapid price increase. Support around $0.0000364 has held during today’s trading and currently provides the first major area to watch.
A break below $0.0000364 could weaken the current structure and expose yesterday’s low near $0.0000317. Greater profit taking across the broader crypto market could place additional pressure on that support.
The main levels currently look like this:
- $0.000045: Major resistance that PEPE needs to break before another attempt at higher prices.
- $0.000050: February resistance that could become the next major target after a breakout.
- $0.000070: A higher bullish target that could become relevant if the broader market recovery continues.
- $0.0000364: Immediate support that has protected Pepe price during today’s pullback.
- $0.0000317: Yesterday’s low and a possible downside target if current support fails.
The broader crypto market remains an important part of this setup. A continued market recovery could help PEPE challenge resistance again. Falling market demand and heavier profit taking could instead send Pepe price back toward the lower support zones.
PEPE RSI Shows the Meme Coin Has Entered Overbought Territory
The Relative Strength Index provides the clearest warning among the current PEPE indicators.
PEPE’s 14 period RSI stands at 80.302. An RSI reading above 70 generally places an asset within overbought territory, and a reading above 80 shows that buying pressure has become particularly strong.
Such a reading does not automatically mean Pepe price must fall. Strong rallies can keep the RSI above 70 for extended periods. However, an RSI above 80 increases the possibility of consolidation or a pullback as early buyers begin taking profits.
The current reading therefore fits the price action near $0.000045. PEPE has climbed quickly, and the market may need to absorb some of those moves before another breakout attempt develops.
PEPE MACD Remains Neutral After the Rapid Price Increase
The MACD reading currently stands at 0, which produces a neutral signal.
MACD measures the relationship between shorter and longer term price trends. A strongly positive reading can support bullish conditions, whereas a negative reading can point toward greater bearish pressure.
PEPE’s neutral reading means the indicator currently provides little confirmation for either direction. That makes price action around $0.0000364 and $0.000045 more useful for judging the next move.
Read Also: Zcash (ZEC) Price Explodes Past $800: Here’s What’s Driving the Rally
Ultimate Oscillator Keeps a Bullish Reading for Pepe Price
PEPE’s Ultimate Oscillator stands at 66.248, which currently produces a buy reading.
The indicator combines several time periods to measure market pressure and reduce the distortions that can appear when only one timeframe is considered.
A reading near 66 shows that buyers still retain considerable strength despite the rejection near resistance. The reading remains below the traditional 70 overbought threshold, although it is getting relatively close to that area.
That creates an interesting contrast with the RSI. The RSI already shows heavily overbought conditions, whereas the Ultimate Oscillator still points toward positive market pressure.
PEPE Bull Bear Power Shows Neither Side Has Clear Control
Bull Bear Power currently reads 0, leaving the indicator neutral.
This indicator compares buying and selling strength relative to an exponential moving average. Positive values generally favor buyers, whereas negative values can indicate stronger seller control.
A reading of 0 means neither side currently has a clear advantage through this particular indicator. The neutral reading becomes more relevant because PEPE is trading close to an important resistance zone after a rapid 4-day advance.
PEPE Technical Indicators Show Strong Demand but Growing Pullback Risk
NameValueActionRSI (14)80.302
Overbought: PEPE has moved into an overheated area after its rapid rally, which increases the possibility of consolidation or profit taking.MACD (12,26)0
Neutral: The MACD currently provides no strong confirmation that buyers or sellers have control of the next Pepe price move.Ultimate Oscillator66.248
Buy: Buying pressure remains strong across multiple time periods, although the indicator is moving closer to overbought territory.Bull Bear Power (13)0
Neutral: Neither buyers nor sellers currently have a clear advantage based on this indicator.
Pepe price now faces a test that could determine whether the 70% rally has more room to run. The RSI warns that PEPE has become overheated, but the Ultimate Oscillator shows that buying pressure has not disappeared.
The $0.000045 resistance and $0.0000364 support provide the clearest boundaries from here. A break above resistance could bring $0.000050 back into view and potentially open the door toward higher levels if the broader crypto recovery continues. Losing support could instead expose $0.0000317 and erase part of the recent advance.
FAQs
Can Pepe meme coin reach $1?No, PEPE meme coin cannot realistically reach $1. It has a circulating supply of over 420 trillion tokens. If one token costs $1, the total market value would be $420 trillion. This amount is much higher than the total money in the entire global economy.
Is Pepe a dead coin?PEPE is not a dead coin, as it maintains a billion-dollar market capitalization, active daily trading volume, and hundreds of thousands of holders. However, it remains a purely speculative asset trading significantly below its peak values.
Subscribe to our YouTube channel for daily crypto updates, market insights, and expert analysis.
The post PEPE Price Explodes 70% to 3-Month High: Here’s What to Expect Next appeared first on CaptainAltcoin.