The latest Pepe price prediction centers on a falling wedge on the hourly chart. PEPE is squeezing toward the lower edge of the pattern, and the next hourly closes could decide the direction.
The latest Pepe price prediction centers on a falling wedge on the hourly chart.
PEPE is squeezing toward the lower edge of the pattern, and the next hourly closes could decide the direction.
The Pepe coin is down 2.5% over the last 24 hours. Traders want to know whether the oversold reading can produce a bounce.
$PEPE now trades near $0.00000469.Pepe is an Ethereum meme coin built around the Pepe the Frog internet meme.
According to CoinGecko, Pepe price today is $0.00000469, within a 24-hour range of $0.00000469 to $0.00000499. PEPE ranks 48th by market capitalization at about $1.974 billion.
Live Pepe Market Data
Metric
Value
PEPE Price
$0.00000469
24h Change
-2.5%
24h Range
$0.00000469 to $0.00000499
Market Cap
$1.974B
Market Rank
#48
Source: CoinGecko, as of November 2, 2026.
Pepe News Today
Pepe news today comes from a BSCN post on X. It says HYPE and PEPE led weekly gains as the wider market cooled.
The post adds that, according to CoinGecko, both tokens are up about 10% over the past week after a correction.
Source: Data taken from the @BSCNews X account, as of November 2, 2026.
The weekly gain contrasts with today's 2.5% decline, and the price now sits at the bottom of its 24-hour range.
This is a single social media post, so treat it as market commentary, not confirmation of a trend.
Pepe Technical Analysis
This Pepe price prediction reads the hourly PEPE/USDT chart on Binance. Price moves inside a falling wedge that formed after the October 30 high.
Both trendlines slope down and are converging, which often comes before a sharp move in either direction.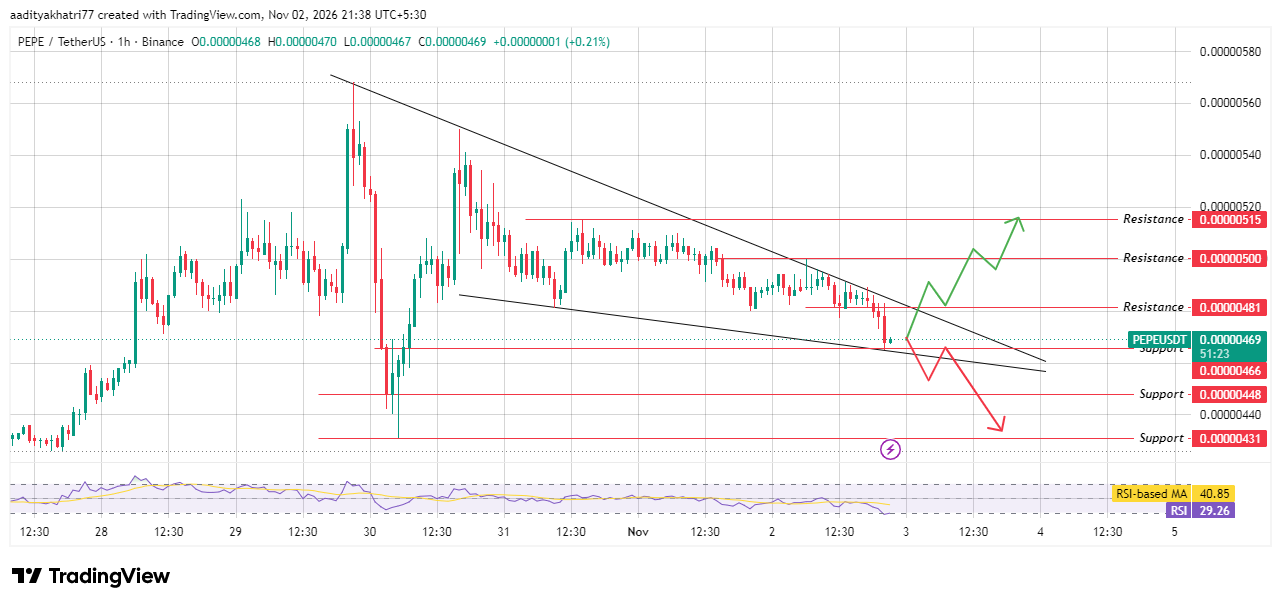
Source: TradingView, PEPE/USDT 1H, Binance, as of November 2, 2026.
The latest candle opened at $0.00000468, ranged from $0.00000467 to $0.00000470, and closed near $0.00000469, a gain of 0.21%. Price is sitting on the lower wedge line and the $0.00000466 support.
The hourly RSI reads 29.26, below its moving average of 40.85. A reading under 30 is oversold and shows selling pressure is stretched.
An oversold RSI can stay low for a while, so it supports a bounce but doesn't guarantee one.
Can $PEPE Bounce and Break $0.00000481?
The bullish case starts with a hold. PEPE needs to defend $0.00000466, the support where price is trading now.
The next step is an hourly close above the falling upper trendline, which sits close to the $0.00000481 resistance.
A breakout from a falling wedge usually targets higher levels, so a close above that zone would open $0.00000500.
If buyers keep control above $0.00000500, the next resistance is $0.00000515. Closes should come with rising volume. A wedge can also break the wrong way, so confirmation matters.
What Happens If $PEPE Loses Support?
The bearish case begins with a rejection at the upper trendline or a slide through $0.00000466.
An hourly close below $0.00000466 and below the lower wedge line would show the bounce has failed.
In that case, $0.00000448 is the first support, and $0.00000431 follows. That is the low from the October 30 sell-off.
A brief wick under support is not enough. If price closes back above $0.00000466 within a few hours, the move may prove a false break.
Price Levels to Watch
Support
Resistance
$0.00000466
$0.00000481
$0.00000448
$0.00000500
$0.00000431
$0.00000515
Bull, Base, and Bear Scenarios for Pepe Price Prediction
Scenario
Setup
Level
Bull
$PEPE defends $0.00000466, then an hourly candle closes above the falling trendline and $0.00000481 on rising volume.
$0.00000500, then $0.00000515
Base
$PEPE keeps moving inside the wedge, with no hourly close outside $0.00000466 or the upper trendline.
Between $0.00000466 and $0.00000481
Bear
Support at $0.00000466 gives way, and an hourly candle closes below it and the lower wedge line.
$0.00000448 first, then $0.00000431
Pepe vs Bitcoin
Any Pepe price prediction outlook should check how $PEPE trades against Bitcoin and Ether.
Over the last 24 hours, $PEPE is down 2.5% in dollars, down 2.2% against Bitcoin, and down 3.1% against Ether.
Those figures imply Bitcoin slipped only about 0.3% and Ether gained about 0.6% in dollar terms.
$PEPE therefore lagged both, and the weekly gain has not yet shown up as relative strength today.
Methodology
This Pepe price prediction draws on three inputs. Market data comes from CoinGecko and was taken on November 2, 2026.
The chart is an hourly PEPE/USDT view from Binance in TradingView, with timestamps in UTC+5:30. The news item comes from a single BSCN post that cites CoinGecko.
Support and resistance levels were read directly from the chart. The wedge trendlines carry no price labels, so where they cross current price is approximate.
CoinGecko uses a rolling 24-hour window, so its 2.5% decline differs from the 0.21% shown on the latest hourly candle.
Trading volume, wallet data, and liquidation data were not part of this review, and the scenarios carry no assigned probabilities.
Expert Opinion
The BSCN post describes PEPE and HYPE moving at a similar pace after a correction. As general market commentary, a 10% weekly gain followed by a pullback to the bottom of a wedge is a common consolidation pattern.
The setup matters more if the hourly RSI turns up from oversold and volume rises on a move toward $0.00000481. In the short term, the $0.00000466 level will show how the market reads it.
Disclaimer: This article is for information only and is not financial advice. PEPE is a highly volatile meme coin. Price can fall below $0.00000431 if support fails or if broader market conditions weaken. No scenario here carries a stated probability, and a confirmed breakout can still reverse. Readers should do their own research and size any position to a loss they can accept.