Pepe price prediction searches are picking up as October begins, and the daily chart explains why. The meme coin is moving inside an ascending channel after a sharp rally, and it has now pull
Pepe price prediction searches are picking up as October begins, and the daily chart explains why.
The meme coin is moving inside an ascending channel after a sharp rally, and it has now pulled back toward the middle of that structure.
This Pepe price prediction October 2026 looks at the chart, derivatives data, and holder distribution to map the next likely move.
$PEPE is trading near $0.00000422, up 1.4% on the day. Market cap sits around $1.777 billion, which keeps it at #59 by market cap.
The Pepe coin price today shows a market that is holding steady while it waits for a clear direction.
Live $PEPE Market Data
Metric
Value
Price
$0.00000422
24H Change
+1.4%
24H Range
$0.000004070 - $0.000004295
Market Cap
$1.777B
Source: market data taken from CoinGecko, as of Sep 29, 2026. Figures may vary slightly across other tracking websites.
The circulating supply already equals the max supply, so no new $PEPE will be issued. Holders do not have to worry about inflation from new tokens.
Pepe Coin News Today: Volume and Liquidation Data
The latest Pepe coin news today comes from derivatives data. The volume heatmap shows where most of the trading activity is happening.
OKX leads with $142.85 million, followed by MEXC at $94.26 million and KuCoin at 35.87million.LBank(27.72 million, and Bitget ($24.77 million) comes next.
Together, OKX and MEXC account for a large share of the tracked volume.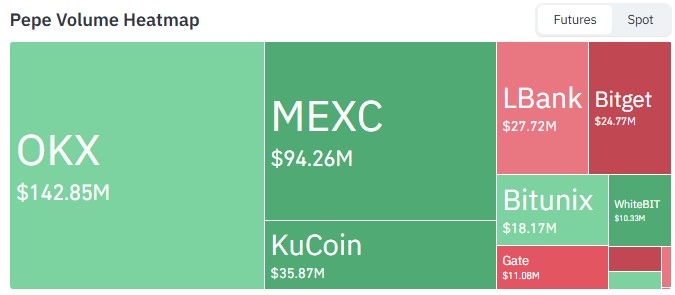
Source: Volume Heatmap Data Taken from CoinGlass.
Liquidation numbers are modest. Over the last 24 hours, about $598.55K was liquidated, of which $420.00K were long positions and $178.54K were short positions.
That means roughly 70% of the liquidated positions were longs, which fits with the recent pullback from the channel top. In the last hour, only $1.13K was liquidated, all of it shorts.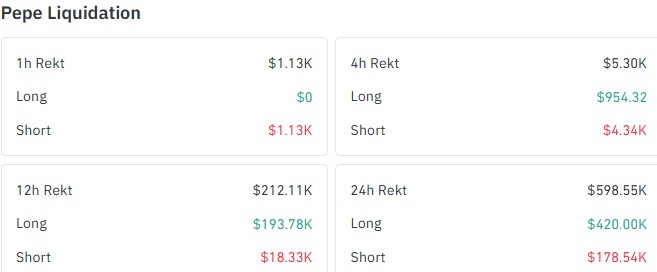
Source:Liquidation Data Taken from CoinGlass.
Such small liquidation figures suggest leverage is not overcrowded right now, so a sudden cascade of forced closures is less likely in the short term.
PEPE Holder Distribution
Holder data shows how concentrated the supply is. The top 100 wallets control 76.88% of the supply, and whale wallets hold 89.93% of the market cap while making up just 0.11% of all holders.
The top 5 holders own 27.95%, and the top 10 own 36.98%. The Gini score sits at 0.9938, which points to very high concentration.
Tier
Holders
% of Market Cap
Whale
641
89.93%
Shark
3,137
4.84%
Dolphin
20,636
3.49%
Fish
76,933
1.41%
Crab
161,258
0.35%
Shrimp
329,074
0.04%
Source: Holder Data Taken from Etherscan.
High concentration cuts both ways. A few large wallets can push the price when they buy and just as easily when they sell.
Some of these large wallets may also belong to exchanges or treasuries, so traders usually treat the number as a risk indicator, not as pure whale buying or selling.
Pepe Coin Technical Analysis
This Pepe coin technical analysis starts with the structure on the daily chart.
On the daily chart, $PEPE is trading inside an ascending channel, a pattern made of two rising parallel trendlines.
Price bounced from the lower boundary in August and September, rallied to a high near $0.00000535, and was then rejected.
It has since pulled back toward the middle of the channel and is trading around $0.00000422.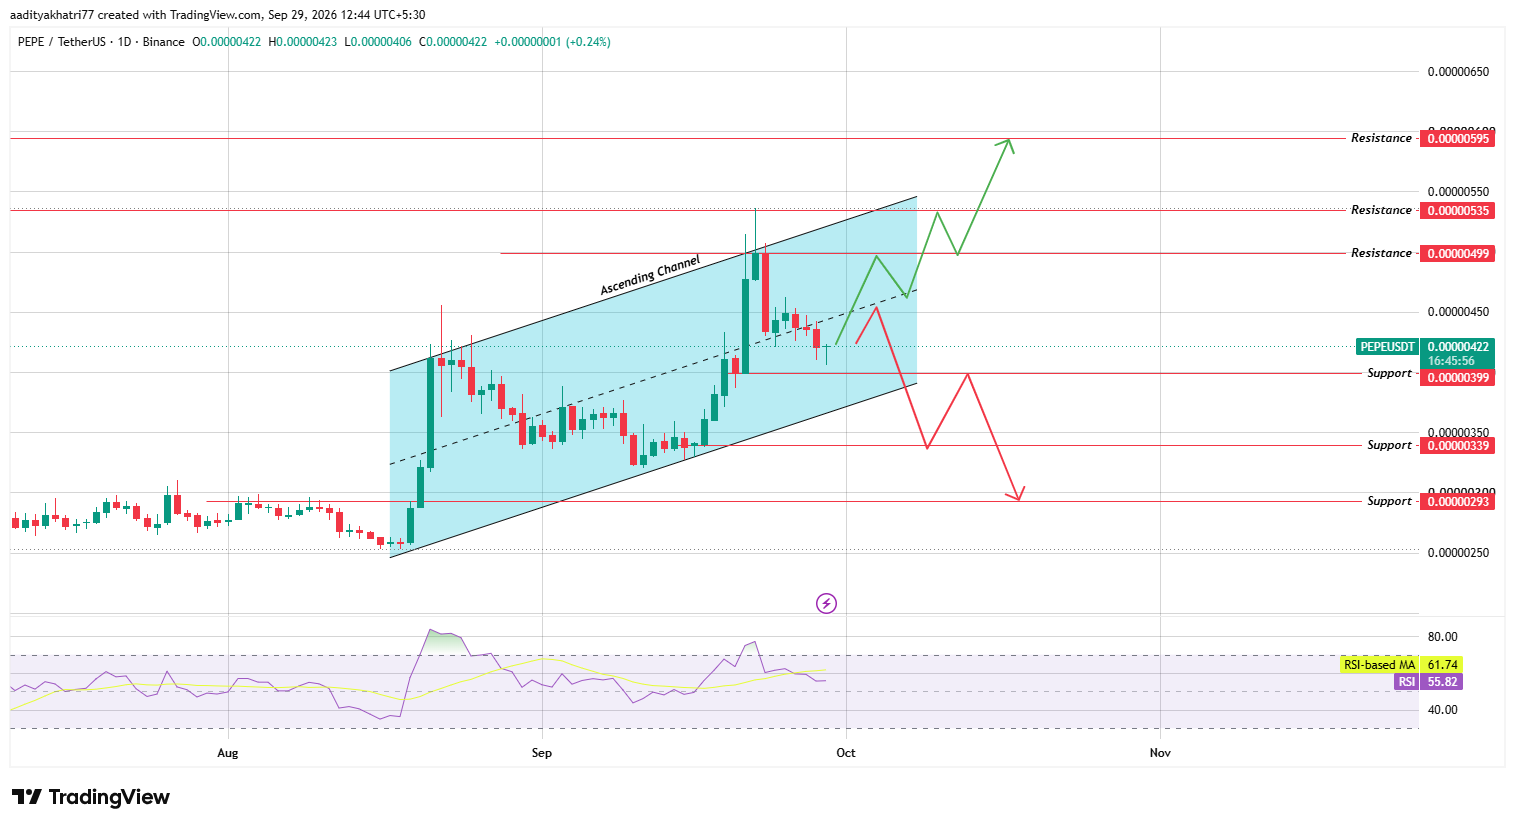
Source: Chart taken from TradingView, as of Sep 29, 2026
RSI reads 55.82, below its moving average of 61.74. Momentum has cooled from the recent push, but RSI is still above the 50 midline, so buyers have not lost control yet. As long as the price stays inside the channel, the broader structure remains bullish.
Can $PEPE Push Toward Higher Resistance?
The bullish setup needs a bounce first. If $PEPE holds the $0.00000399 support and bounces, the next task is to break the $0.00000499 resistance. That level is the first real hurdle on the way up.
A daily close above $0.00000499 opens the path toward $0.00000535, which is close to the recent swing high. If buyers keep control and volume supports the move, the next Pepe price level to watch is $0.00000595.
A breakout without volume can easily fail and send price back into the channel. That is why the close matters more than a wick above the line.
What Happens If $PEPE Breaks the Channel Support?
The bearish setup works in steps too. First, $PEPE has to lose the $0.00000399 support. After that, a break of the lower boundary of the ascending channel would confirm that the uptrend has ended.
In that case, the first downside target is $0.00000339. If sellers stay in control, $0.00000293 becomes the next major support zone.
Once a channel breaks, the move can be fast, because traders who bought inside the channel start to exit together. That is the risk on the other side of this trade.
Pepe Price Levels to Watch
Support
Resistance
$0.00000399
$0.00000499
$0.00000339
$0.00000535
$0.00000293
$0.00000595
Bull, Base, and Bear Scenarios
Scenario
Setup
Level
Bull
Bounce and resistance break with volume.
$0.00000499 to $0.00000595
Base
Channel holds, range trade
$0.00000399 to $0.00000499
Bear
Support and channel break
$0.00000339 to $0.00000293
Pepe vs Bitcoin and Ethereum
Bitcoin's direction usually sets the tone for meme coins like PEPE. A risk-on market helps breakouts hold above resistance, while a risk-off move can pull PEPE's support levels lower no matter what the chart says.
On the pairs, PEPE is up 0.3% against Bitcoin and down 0.9% against Ethereum, which shows it is moving broadly in line with the majors right now.
Methodology
This Pepe price prediction was built from a daily PEPEUSDT chart sourced through Binance via TradingView.
The ascending channel boundaries, RSI, and RSI-based moving average were checked candle by candle.
Support and resistance levels came directly from the marked price zones on that chart.
Live price, market cap, volume, and supply figures came from a CoinGecko snapshot, while volume, liquidation, and holder data came from separate snapshots taken the same day.
Nothing here substitutes for independent research. A chart pattern only describes probability, not certainty.
Expert Opinion
Based on the chart and derivatives data, the setup for October leans cautiously constructive while $PEPE stays inside the ascending channel. Low liquidations suggest leverage is not stretched, and RSI is still above 50.
At the same time, the heavy whale concentration and the cooling RSI mean the next reaction at $0.00000399 matters. A bounce means little if PEPE cannot clear $0.00000499 with volume behind it.
Disclaimer: This article is for informational purposes only and does not constitute financial advice. Cryptocurrency markets, including Pepe, carry high volatility and downside risk; prices can move sharply against any projected level, and past performance offers no guarantee of future results. Readers should conduct independent research before making any investment decision.
