Pi Network started out as a mobile mining app back in 2019, letting everyday users earn $PI simply by tapping a button daily rather than burning electricity like traditional mining. It grew a
Pi Network started out as a mobile mining app back in 2019, letting everyday users earn $PI simply by tapping a button daily rather than burning electricity like traditional mining.
It grew a massive user base over several years before finally opening up mainnet and exchange trading, turning a long-running IOU into an actual tradable asset.
$PI is trading around$0.0921, up 4.7% in the past 24 hours.
Live Market Data
Here's the live snapshot behind this Pi network price prediction as of writing.
Metric
Value
Price
$0.09286
24h Change
+4.7%
Market Cap
$1.029B
Fully Diluted Valuation
$1.583B
24h Trading Volume
$9.3M
Circulating Supply
11.077B
Total Supply
17.041B
Max Supply
100B
Source: $PI market cap data taken from Coingecko, data as of Aug 21, 2026. Figures may vary slightly across other tracking websites.
$PI Social Sentiment
Recent commentary around Pi Network has focused on a possible PayPal connection through a "Pay with Crypto" style program, with speculation suggesting PayPal might support $PI. 
Source: Data Taken From @PiNewsMedia, X Account.
That said, according to the current list of KYB-verified businesses on the Pi ecosystem, PayPal has not been officially confirmed as a verified partner the way platforms like OKX and MEXC have been. For now, the PayPal to PI connection remains unconfirmed.
Why it matters for PI: partnership rumors like this often move sentiment before anything is verified, so this PI network price prediction treats the news as unconfirmed chatter rather than a confirmed catalyst until PI's official channels say otherwise.
Key Takeaways
On the 1-hour chart, $PI is riding inside an ascending channel, and this pi network price prediction hinges on which side of that channel gives way first.
Price is trading near $0.0921, up 4.7% over the past 24 hours.
The daily chart shows $PI still working through a symmetrical triangle, with the breakout not confirmed yet.
A confirmed daily breakout could send the price toward $0.09643, then $0.10391, with $0.11908 further out.
A liquidity sweep followed by rejection could just as easily drag the price back toward the $0.08259 support shelf.
Social chatter around a PayPal partnership is circulating, but $PI's own KYB-verified business list has not confirmed PayPal yet.
Technical Analysis: Hourly Chart Analysis for $PI
On the hourly chart, PI has been climbing inside a clean ascending channel, with price stairs stepping between the upper and lower boundaries rather than breaking either one decisively. 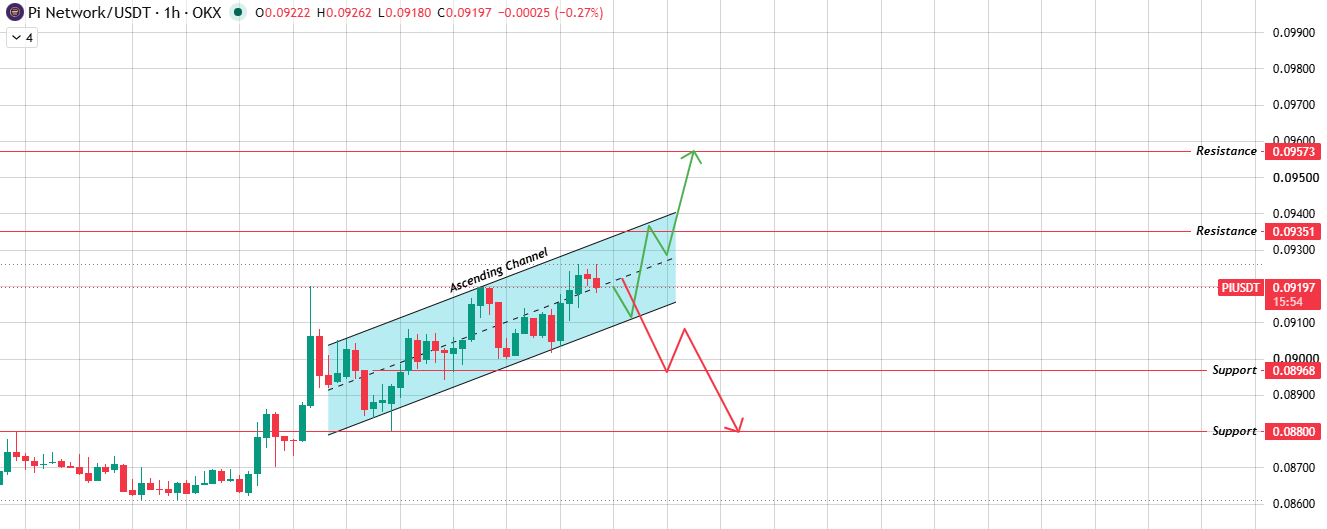
Source: Chart Taken From TradingView.
If the price clears the upper boundary of that channel on strong volume, the next stop sits near $0.09351, followed by $0.09573 if the move keeps going.
If instead the price slips through the lower boundary, expect a drop toward the $0.08968 support first, with $0.08800 as the next level down if selling pressure keeps up.
Daily Chart Analysis for $PI
Zoom out to the daily chart, and $PI is working through a symmetrical triangle that has been compressing for a while now, with price currently testing the upper edge of that structure.
The breakout here is still running, meaning it has not fully confirmed either direction yet. 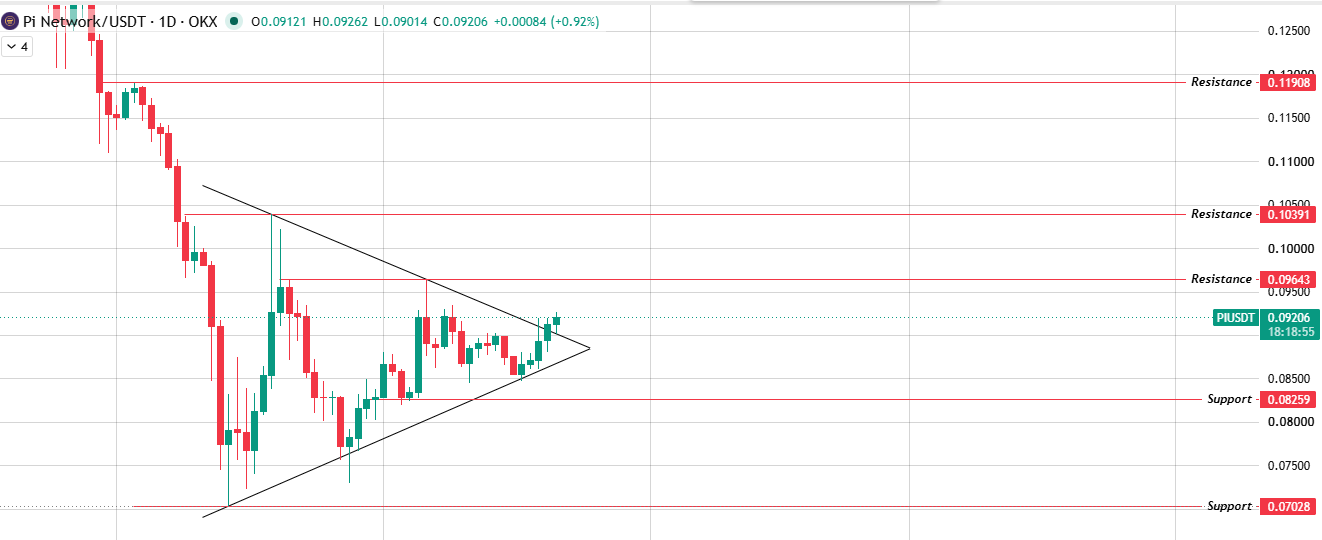
Source: Chart Taken From TradingView.
If that breakout confirms to the upside, this Pi network price prediction points toward $0.09643 first, then $0.10391, with $0.11908 as the bigger stretch level.
If price instead sweeps liquidity above the triangle and then gets rejected, a move back down toward the $0.08259 support becomes the more likely path, with $0.07028 as the deeper level below that.
Support and Resistance Levels
Hourly Support and Resistance Levels
Level
Type
0.09573
Resistance
0.09351
Resistance
0.09197
Current Price
0.08968
Support
0.08800
Support
Daily Support and Resistance Levels
Level
Type
0.11908
Resistance
0.10391
Resistance
0.09643
Resistance
0.09206
Current Price
0.08259
Support
0.07028
Support
Bull, Base, Bear Case
This pi network price prediction leans on the daily symmetrical triangle as the main structure, with the 1H channel adding short-term context.
Case
Level
Setup
Invalidation
Bull
0.10391
Daily triangle breakout confirms upward; 1H channel upper boundary clears with volume backing it.
Daily close back below 0.08259
Base
0.09643
Nearest daily resistance, first test right above the triangle apex
Loss of the 0.09000 area on a daily close
Bear
0.08259
Liquidity sweep above the triangle gets rejected, and price falls back through both channel supports
Daily close under 0.07028
Glossary
Ascending Channel: A rising price structure bound by two parallel trendlines, one connecting the highs and one connecting the lows.
Symmetrical Triangle: A chart pattern where price compresses between two converging trendlines, usually resolving with a breakout in either direction.
Liquidity Sweep: A quick move past a key level that triggers stop orders before the price reverses back the other way.
KYB (Know Your Business): A verification process businesses go through to confirm legitimacy before being listed as an official partner or integration.
Market Cap:A coin's price multiplied by its circulating supply, used to gauge overall size relative to other assets.
Methodology
This pi network price prediction draws on multi-timeframe chart structure across the 1-hour and daily charts, current market data, and verified ecosystem news.
Price levels referenced here come directly from chart structure rather than extrapolation, and any unconfirmed partnership claims are checked against Pi's own official sources before being included.
Markets move fast, so treat these levels as a framework rather than a fixed outcome.
Disclaimer: This article is for informational purposes only and does not constitute financial advice. Cryptocurrency markets, including Pi Network, are highly volatile and carry significant risk. Always do your own research and consult a licensed financial advisor before making investment decisions.