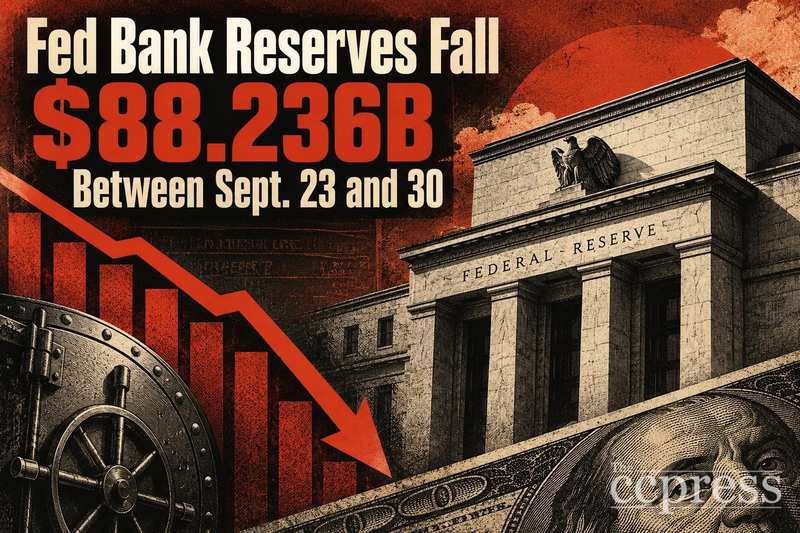
What's the story behind the Pi Network price forecast, in plain terms? PI's up 2.4%, trading near $0.09, a fraction of the buzz it drew when its mobile mining app first pulled in millions of
What's the story behind the Pi Network price forecast, in plain terms? PI's up 2.4%, trading near $0.09, a fraction of the buzz it drew when its mobile mining app first pulled in millions of users.
Market cap sits close to $994 million, enough to keep it inside the top 100 assets by size.
One thing keeps coming up in the community, though: PI already trades on several solid exchanges, yet the two biggest names in the industry haven't listed it.
That wait explains a lot of why sentiment around this coin swings so hard.
Live Market Data
$PI is currently trading at $0.09005, up 2.4% over the past 24 hours. The day's range has run from $0.08642 to $0.09082. 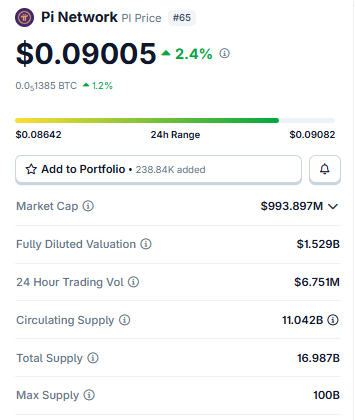
Source: $PI Network market cap data taken from Coingecko, data as of Aug 08, 2026. Figures may vary slightly across other tracking websites.
Market cap holds near $993.897 million, with a fully diluted valuation around $1.529 billion. Daily volume came in at $6.751 million.
Circulating supply stands at 11.042 billion tokens against a 16.987 billion total supply, with a max supply capped at 100 billion.
Pi Network News Today:
Worth noting what's floating around the community on PI's exchange situation.
Pi Network commands one of the largest followings in crypto, and $PI already trades as a top 100 asset, so the take goes. 
Source: Data Taken From @BSCNews, X Account.
It's already secured listings on a handful of solid exchanges.
The two biggest names in the industry, though? Still sitting this one out. That gap keeps the debate alive over what's holding a bigger listing back and whether it happens at all.
Key Takeaways
PI is sitting near $0.09005 right now, boxed inside a descending triangle on the 1H chart. That's the starting point for this Pi Network price forecast.
Upper boundary breaks with volume? Price could run toward $0.09354, then $0.09636.
Rejected instead, with the triangle's support giving way, and $0.08431 comes into view, and $0.08202 after that.
Over on the 4H chart, PI is riding an ascending channel. Clear the top with volume, and $0.10395 opens up, $0.11855 beyond it.
Lose the channel's lower boundary, though, and the slide could reach $0.08259, maybe down to $0.07430.
Technical analysis for the Pi Network price forecast.
Here's what both timeframes behind this Pi Network Price Forecast actually show.
Hourly Chart Analysis of $PI Forecast:
The price is inside a descending triangle right now. 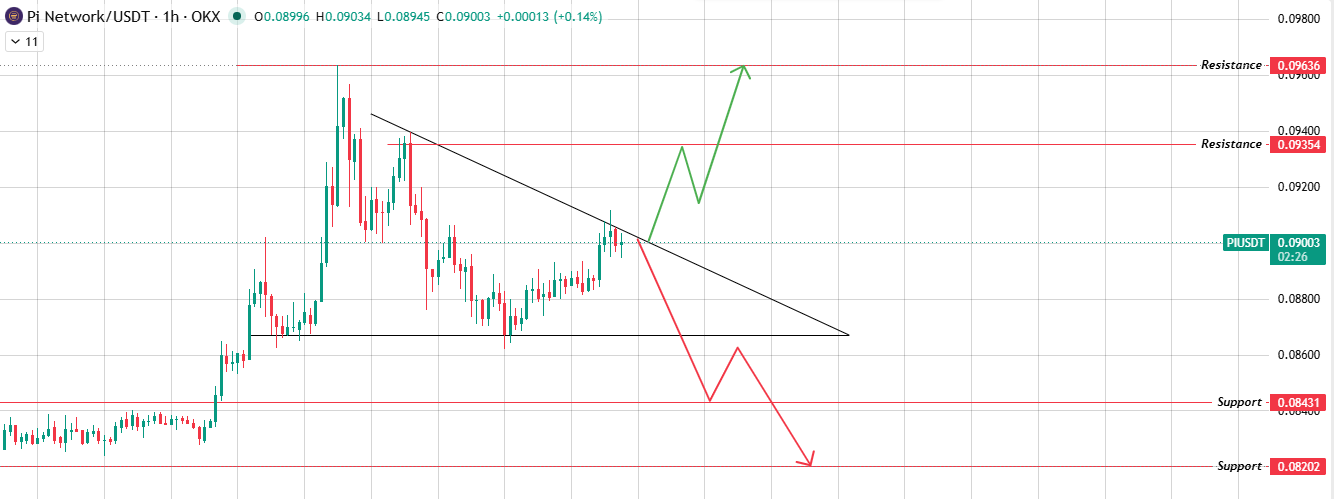
Source: Chart Taken From TradingView
Break the upper boundary with volume, and it moves toward the upper resistance levels, $0.09354 first, then $0.09636.
Get rejected from that boundary instead, with the triangle's support breaking down, and it heads for the lower support levels, $0.08431 then $0.08202.
4-Hour Chart Analysis of $PI Forecast:
The $PI price is riding inside an ascending channel here. Break the upper boundary of the channel with volume, and it goes toward the upper levels, $0.10395, then $0.11855. 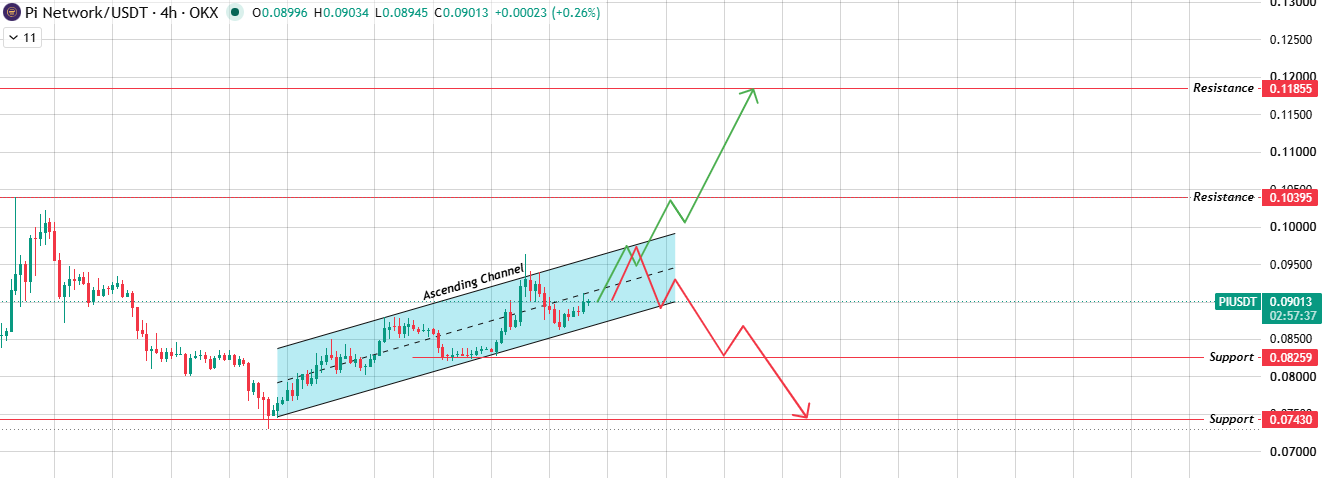
Source: Chart Taken From TradingView
Rejected there instead? It typically comes back down to the channel's lower boundary first. Break that too, and the lower support levels come into play: $0.08259 then $0.07430.
Bull, Base, and Bear Case
Three ways this Pi Network price forecast could play out are laid out below.
ScenarioWhat Has To HappenPrice TargetsBullThe 1H triangle's upper boundary breaks with volume, and the 4H channel's upper boundary follows.
$0.09354 first, then
$0.09636; a 4H breakout extends that toward
$0.10395 and
$0.11855.BasePrice stays boxed inside both the 1H triangle and the 4H channel, with no clean break either way.Chop, roughly between
$0.08431 and
$0.09354.BearThe 1H triangle rejects the price at resistance and support breaks, and then the 4H channel's lower boundary follows.
$0.08431 first, then
$0.08202; a deeper break opens
$0.08259 and
$0.07430.
Glossary
Price is boxed between two converging lines, one flat and one sloped downward; that's a descending triangle.
Usually resolves with a breakout in one direction or the other. What's an ascending channel? Two parallel lines sloping upward, price bouncing between them until one side finally gives way.
Resistance, simply put, is a price level where selling pressure has shown up before, making it harder for price to climb through.
Ever wonder what support means on a chart? A level where buying has stepped in before, often slowing or reversing a decline.
And a breakout? That price is moving decisively past a boundary, ideally with stronger than usual volume behind it.
Methodology:Every level in this Pi Network Price Forecast comes straight from 1H and 4H chart analysis. Nothing gets extrapolated beyond what those charts actually show.
Disclaimer: This article is for informational purposes only and does not constitute financial advice. Cryptocurrency markets are highly volatile and speculative. Estimated probabilities reflect technical analysis of chart patterns, not certainty. Always conduct independent research and consult a licensed financial advisor before making investment decisions.