Pi Network has spent September consolidating above a level that has held firm for weeks, and this Pi Network price prediction looks at whether that patience is about to pay off. The setup lea
Pi Network has spent September consolidating above a level that has held firm for weeks, and this Pi Network price prediction looks at whether that patience is about to pay off.
The setup leaves traders watching a single line on the chart to decide the coin's next direction.
Pi Network began as a mobile mining project in 2019 before launching its mainnet and opening its token to open trading in 2025.
It has since built out an ecosystem around its Stellar-based consensus mechanism.
The Pi Coin price today is $0.08505, up 0.2% over the past 24 hours, with a market capitalization of $955.529 million and a fully diluted valuation of $1.47 billion.
Live Market Data
Metric
Value
Price
$0.08505
24H Change
+0.2%
24H Range
$0.0832 - $0.0854
Market Cap
$955.529M
Fully Diluted Valuation
$1.47B
24H Trading Volume
$4.737M
Circulating Supply
11.243B
Total Supply
17.297B
Max Supply
100B
Source: market data taken from CoinGecko, as of Sep 20, 2026. Figures may vary slightly across other tracking websites.
Pi Network News Today
Pi Network Coin news has turned toward the network's underlying technology rather than price action alone. 
Source: Data Taken From @BSCNews, X Account, as of Sep 20, 2026
BSCN published a breakdown examining how Pi Network's Stellar consensus mechanism functions and what it means for the wider ecosystem, prompting fresh discussion among holders about the project's technical foundation.
Coverage like this has added a layer of fundamental interest to the Pi Network coin narrative, even as traders keep their focus on the chart's immediate support and resistance zones.
Pi Network Technical Analysis
On the daily chart, tracked against OKX data with candles closing at 12:43 UTC+5:30 on September 20, 2026, PI coin trades at $0.08502, holding above a rising trendline that has supported price since July. 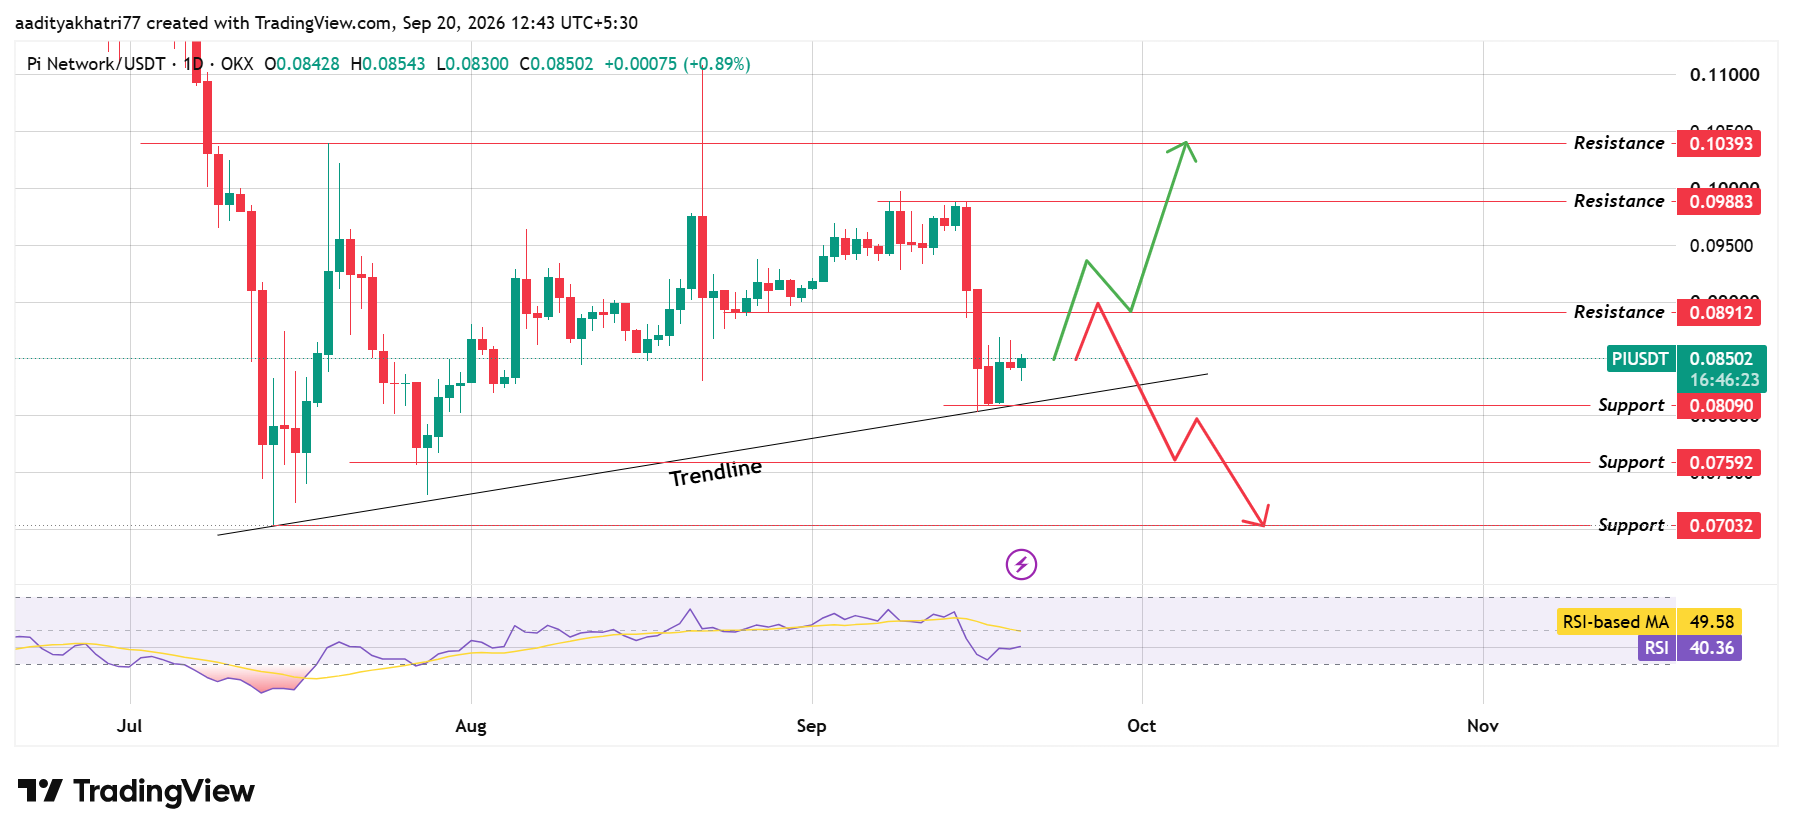
Source: Chart taken from TradingView, as of Sep 20, 2026The Relative Strength Index sits at 40.36, below its moving average of 49.58, indicating momentum remains soft even as price stays structurally bullish above the trendline.
This pi network technical analysis treats the trendline and the resistance zone directly above it as the two levels that matter most right now.
Can PI Coin Break Above Resistance And Rally Further?
If the price holds above the rising trendline and clears the immediate resistance zone with rising volume, PI coin could extend toward higher levels.
A confirmed daily candle close above $0.08912 would open the path toward $0.09883, and a stronger push could bring the $0.10393 resistance zone into play.
This scenario would mark PI's clearest attempt yet at reclaiming levels last seen earlier in the year.
What Happens If $PI Gets Rejected at Resistance?
A rejection from the resistance zone followed by a break of the rising trendline would shift the outlook toward the downside.
A confirmed close below the trendline could send the price toward $0.08090, with a deeper decline targeting $0.07592 and eventually $0.07032 if selling pressure builds.
This would delay any near-term breakout attempt and put PI back into a defensive posture.
Pi Network Support and Resistance Levels
Support
Resistance
$0.08090
$0.08912
$0.07592
$0.09883
$0.07032
$0.10393
Bull, Base, and Bear Scenarios
Scenario
Setup
Level
Bull
Trendline holds, breakout above resistance
$0.10393
Base
Price consolidates between the trendline and resistance
$0.0810 - $0.0891
Bear
Trendline breaks on rising sell volume
$0.07032
Pi Network vs Bitcoin
PI coin's price behavior continues to mirror the broader crypto market's relationship with Bitcoin.
When the Bitcoin price today holds steady or trends upward, smaller-cap tokens like PI often see improved risk appetite, which can help sustain breakout attempts like the one currently forming above its trendline.
Bitcoin's relative stability in recent sessions has given PI room to consolidate constructively rather than face forced selling, though a sharp shift in Bitcoin's own trend would likely influence how the current resistance test resolves.
Expert Opinion
Market commentary around Pi Network has increasingly focused on the project's technical fundamentals alongside its price chart.
Analysts note that renewed attention on the Stellar consensus mechanism, following recent coverage explaining how the network functions, has coincided with PI holding its trendline structure rather than breaking down.
The general view is that a clean breakout above resistance would need both continued fundamental interest and stronger volume confirmation to be considered reliable rather than a short-lived spike.
Disclaimer: This article is for informational purposes only and does not constitute financial advice. Cryptocurrency prices are highly volatile, and PI coin could move in either direction regardless of the scenarios outlined above. Actual price movement may fall short of, or exceed, the levels discussed, and downside risk should be weighed carefully before making any investment decision.