The latest Pi Network price prediction gaining attention after the Pi Ecosystem Summit announced a Q1 2027 mainnet plan for its DEX. Traders want to know whether the news can keep the rebound
The latest Pi Network price prediction gaining attention after the Pi Ecosystem Summit announced a Q1 2027 mainnet plan for its DEX.
Traders want to know whether the news can keep the rebound alive. PI now trades near $0.06076.
Pi Network began as a mobile mining project in 2019 and launched its Enclosed Mainnet in December 2021. It transitioned to Open Network in February 2025.
According to CoinGecko,Pi Network price today is $0.06076, within a 24-hour range of $0.05846 to $0.06203. PI ranks 86th by market capitalization at about $692.3 million.
Live Pi Network Market Data
Metric
Value
PI Price
$0.06076
24h Change
+2.5%
24h Range
$0.05846 to $0.06203
Market Rank
#86
Source: CoinGecko, as of November 18, 2026.
Pi Network News Today
Pi Network news today centers on the Pi Ecosystem Summit. A post from BSCN says the network announced on Day 1 that its Launchpad, decentralized exchange, and AMM will reach Mainnet in Q1 2027.
It adds new developer tools, AI-assisted development features, and ecosystem incentives.
Source: Data Taken From the @BSCNews X Account, as of November 18, 2026.
The post also lists an app growth initiative with up to 20 million Pi in marketing support.
At today's price, that equals about $1.2 million. It notes testnet integrations for subscription smart contracts and X402 payments.
Pi Network's own summit blog post lists the same items. The Q1 2027 date is a plan, and the blog says the products will first go through more testnet rounds.
Pi Network Technical Analysis
This Pi Network price prediction for November 18 reads the hourly PI/USDT chart on OKX.
Price fell sharply on the morning of November 17, from near $0.062 to below $0.0570. It then built an ascending channel, and both trendlines slope upward.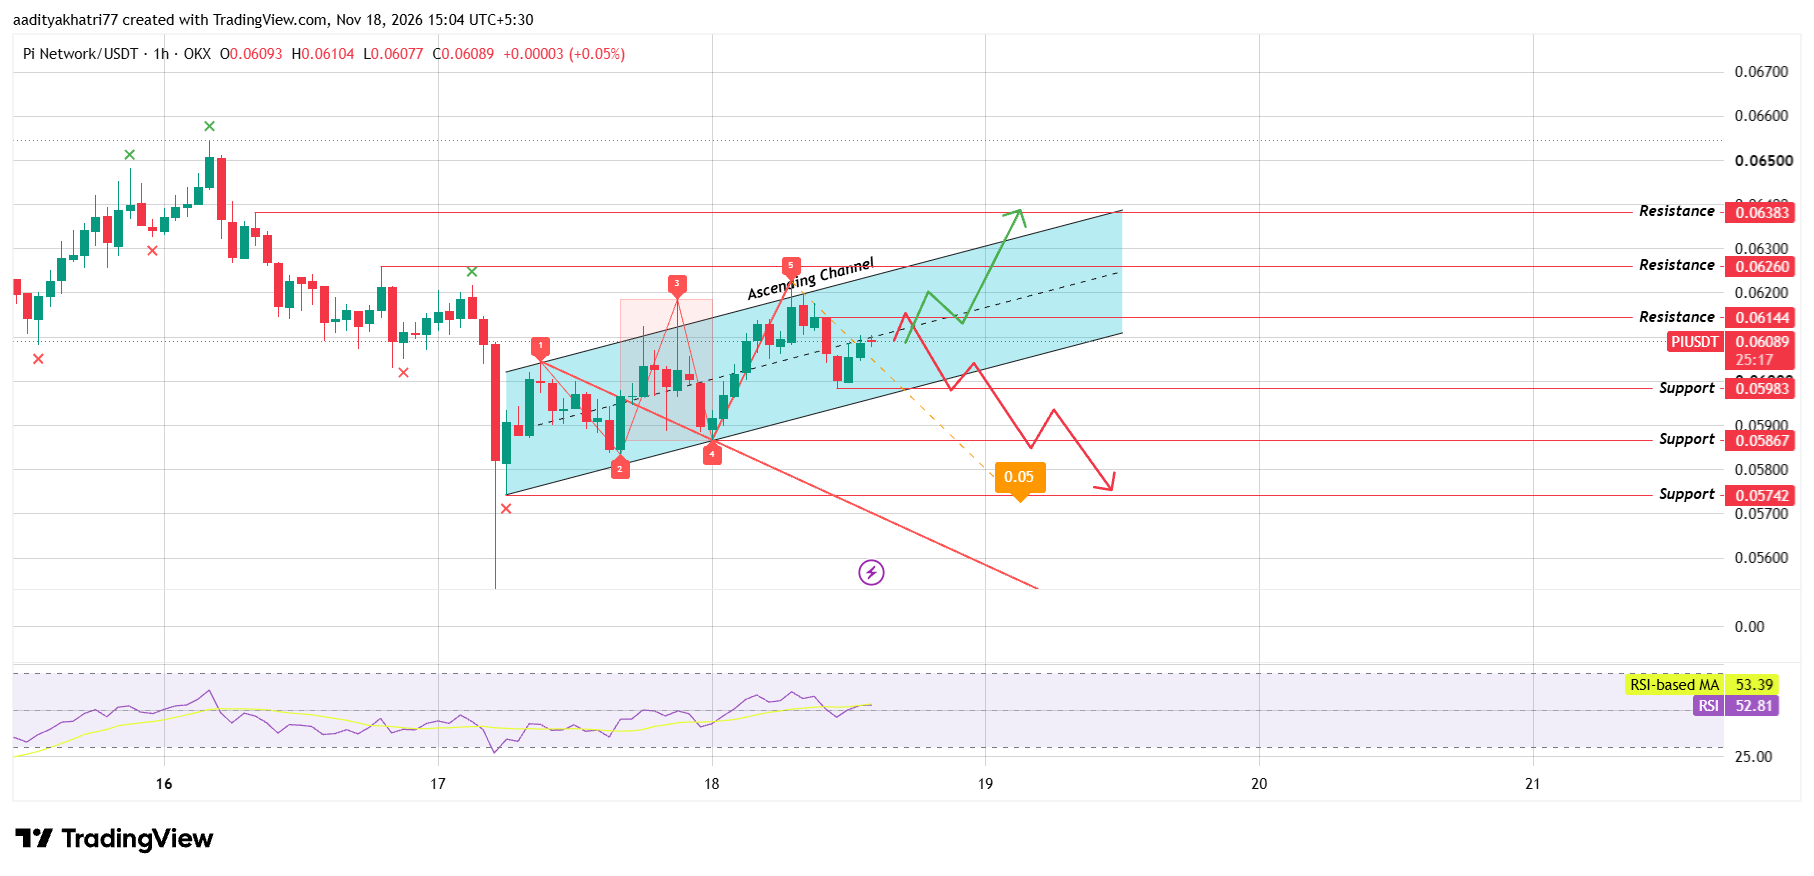
Source: TradingView, PI/USDT 1H, OKX, as of November 18, 2026.
The upper line now runs near $0.0623 and the lower one near $0.0595, so the price sits close to the middle.
The chart also marks a Wolfe wave with five points inside the channel. Its line from point 1 through point 4 slopes down and now runs near $0.0574.
The latest candle opened at $0.06093, ranged from $0.06077 to $0.06104, and traded near $0.06089, a gain of 0.05% against previous day's candle.
The RSI reads 52.81 against its average of 53.39, which shows neutral momentum.
Can $PI Bounce and Break the Channel Resistance?
The bullish case starts with a hold. PI needs to keep $0.05983 and the lower channel line, near $0.0595, intact, since buyers defended that zone earlier today.
The next step is an hourly close above $0.06144 with volume over the 20-period average.
After that, the upper channel line near $0.0623 and $0.06260 forms the main test. A close on thin volume would carry little weight at either level.
A confirmed break would open $0.06383. Both $0.06260 and $0.06383 mark swing highs from November 16, so sellers may appear there.
What Happens If $PI Loses Support?
The bearish case begins with a rejection at the upper channel line. In that case, the price would likely slide back toward $0.05983, the first support.
An hourly close below it and the lower channel line, on selling volume above the 20-period average, would break the channel.
The next supports are $0.05867 and $0.05742. The Wolfe wave line sits near that last level and points lower with time.
No marked support sits under $0.05742, and the November 17 wick reached lower.
If price closes back above $0.05983 within a few hours, the move may prove a false break.
Price Levels to Watch
Support
Resistance
$0.05983
$0.06144
$0.05867
$0.06260
$0.05742
$0.06383
Bull, Base, and Bear Scenarios for Pi Network Price Prediction
Scenario
Setup
Level
Bull
$PI holds $0.05983, then an hourly candle finishes above $0.06144 and the upper channel line.
$0.06260 first, then $0.06383
Base
$PI keeps rising and falling inside the channel, with no hourly close beyond $0.05983 or $0.06144.
Between $0.05983 and $0.06144
Bear
Support at $0.05983 gives way, and an hourly candle settles under it and the lower channel.
$0.05867 first, then $0.05742
Pi Network vs Bitcoin
Any Pi Network price prediction outlook should check how $PI trades against Bitcoin.
Over the last 24 hours, PI is up 2.5% in dollars and up 2.0% against Bitcoin. Together, those figures imply that Bitcoin gained about 0.5% in dollar terms.
$PI therefore beat Bitcoin. The gain is mostly specific to the token.
Methodology
This Pi Network price prediction forecast draws on three inputs. Market data comes from CoinGecko and was taken on November 18, 2026.
The chart is an hourly PI/USDT view from OKX in TradingView, with timestamps in UTC+5:30. The news item comes from a BSCN post, checked against the Pi Network summit blog post.
Support and resistance levels were read directly from the chart. The channel lines carry no labels, so the $0.0623 and $0.0595 readings are approximate.
The Wolfe wave points were drawn by hand, and the line near $0.0574 is an estimate. An orange marker on the chart shows only "0.05" so no price target is taken from it.
The $1.2 million figure is simple arithmetic at today's price. Trading volume, liquidation data, and exchange flows were not part of this review, and the scenarios carry no assigned probabilities.
Expert Opinion
The Q1 2027 date is a roadmap item, not a launch. As general market commentary, a dated roadmap adds clarity, yet it does not change supply or demand today. Product dates can also slip.
In the short term, the $0.05983 level and the volume on any move toward $0.06144 will show whether buyers give the news weight.
Disclaimer: This article is for information only and is not financial advice. PI is volatile, and price can fall below $0.05742 if support fails and broader market conditions weaken. Wolfe wave readings are subjective, and roadmap dates can slip. Hourly breakouts reverse often. No scenario here carries a stated probability, and a confirmed breakout can still fail. Readers should do their own research and size any position to a loss they can accept.