Can Pieverse climb back to $2.2414, or will sellers keep control after the recent pullback? This Pieverse price prediction begins with PIEVERSE trading in a tight band after a fast pullback f
Can Pieverse climb back to $2.2414, or will sellers keep control after the recent pullback?
This Pieverse price prediction begins with PIEVERSE trading in a tight band after a fast pullback from its November high. Traders tracking thechannel breakout levels will notice that price keeps pressing a falling trendline, a sloping line drawn across recent highs. The next move out of that squeeze sets the tone for the week.
Pieverse Price Forecast: 24-Hour Snapshot
CoinGecko market data ranks Pieverse 107th, with a market cap of $462.421M. The coin gained 18.2% over seven days.
Metric
Value
Price
$1.68
7-day change
+18.2%
24h range
$1.58 to $1.76
Market cap
$462.421M
Market cap rank
107th
FDV
$1.683B
Circulating supply
274.75M PIEVERSE
Total supply
1B PIEVERSE
Source: Pieverse market snapshot from CoinGecko, captured Nov 14, 2026, 10:30 UTC
fully diluted valuation, is the value of the full 1B token supply at the current price. At $1.683B, it sits far above the $462.421M market cap, so tokens outside circulation matter for any Pieverse price prediction.
Pieverse Price Forecast Risk: Top 10 Wallets Hold 92.33%
Data fromBscScan token holders lists 348,715 wallets, yet supply sits in very few hands. The top 100 wallets hold 98.53% of market cap, and the top 10 hold 92.33%.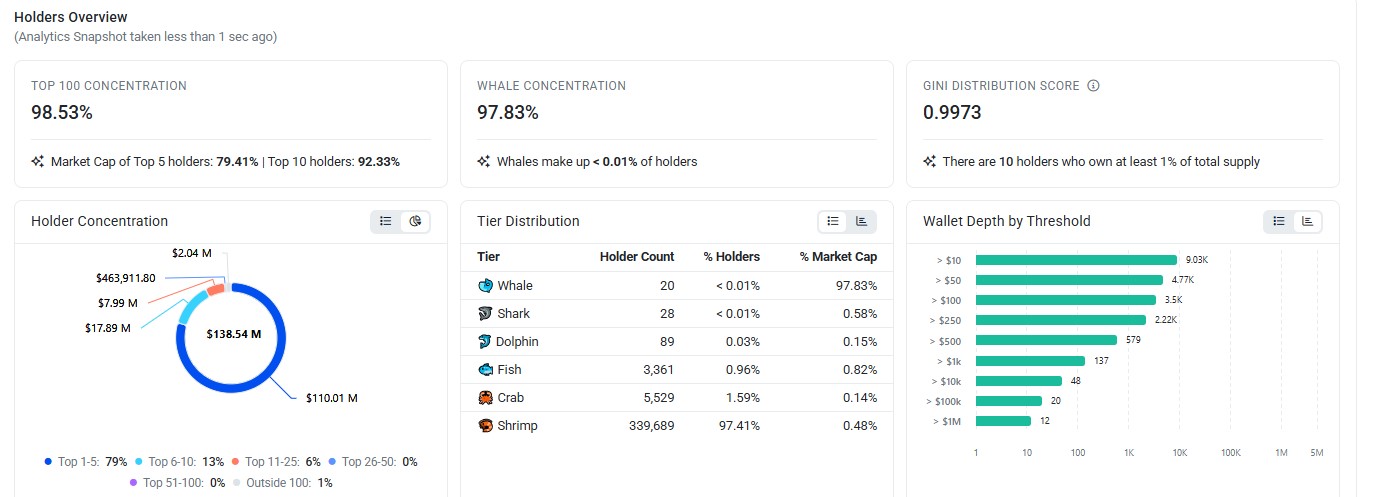
Source: Pieverse holder concentration from BscScan, captured Nov 14, 2026, 10:30 UTC.
Whales, meaning very large wallets, make up 97.83% of market cap across 20 addresses, and the Gini score, where 1 means a single wallet holds everything, reads 0.9973.
BscScan rich list names Bybit Hot Wallet 4 as the largest address at 21.1709%, worth $32.22M. Exchange-labeled wallets on Bybit and Gate together hold 35.92%.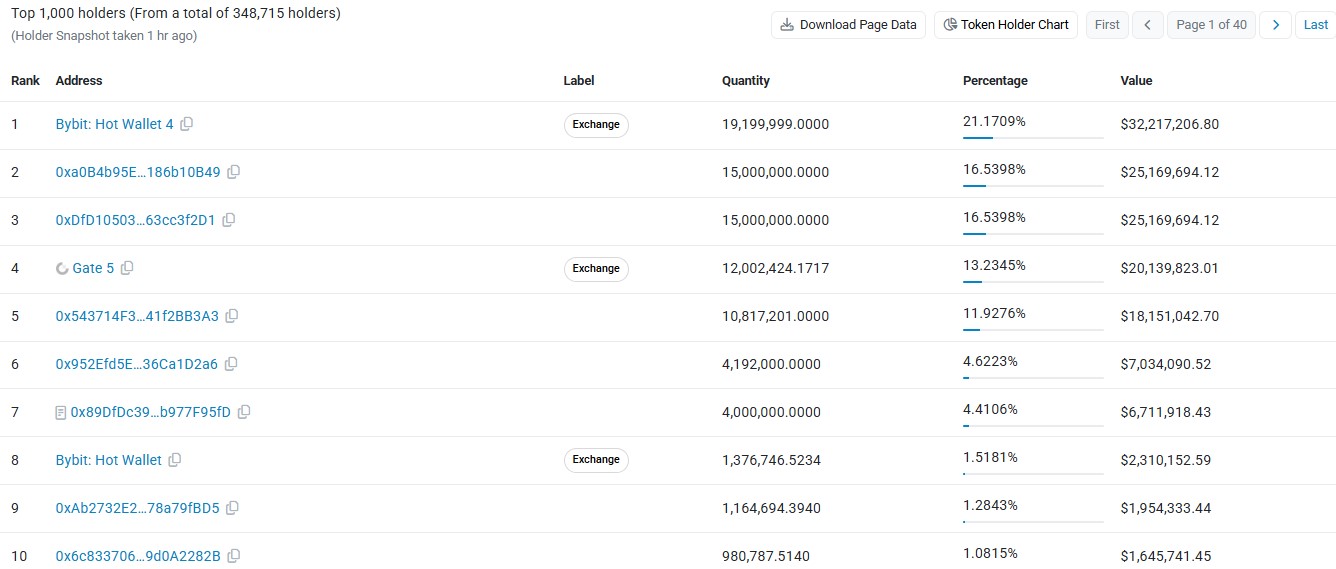
Source: Pieverse top 10 holders from BscScan, captured Nov 14, 2026, 10:30 UTC.
Coins parked on exchanges can reach the order book, the live list of buy and sell orders, fast. Traders tracking whale moves can follow the latestcrypto market news for context. A single transfer from an unlabeled wallet holding 16.5398% could hit the price just as hard.
Pieverse Open Interest: $70.87M Across Futures Exchanges
Open interest is the total value of perpetual futures, contracts with no expiry date, that traders still hold open. When it rises during a sideways move, traders are adding positions.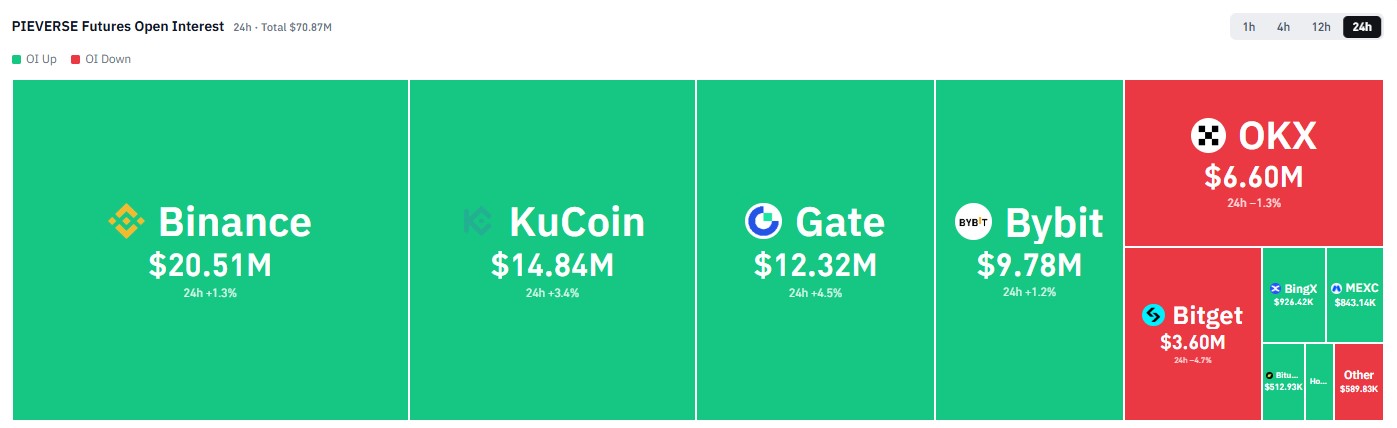
Source: Pieverse futures open interest by exchange from CoinGlass, captured Nov 14, 2026, 10:30 UTC.
Total open interest reaches $70.87M over 24h, per theCoinGlass futures data. Binance holds $20.51M, and KuCoin holds $14.84M. Gate holds $12.32M, and Bybit holds $9.78M.
Gate added 4.5% in open interest, and KuCoin added 3.4%. OKX shed 1.3%, and Bitget lost 4.7%. So who's adding risk while the price moves sideways? Most major exchanges show rising positions. 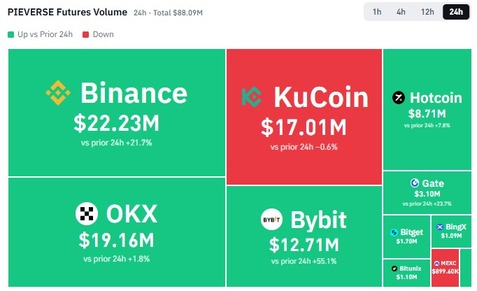
Source: Pieverse futures volume by exchange from CoinGlass, captured Nov 14, 2026, 10:30 UTC.
Futures volume totals $88.09M over 24h. Binance traded $22.23M, and OKX traded $19.16M. KuCoin traded $17.01M, and Bybit traded $12.71M, with Bybit volume up 55.1% against the prior 24 hours.
That's over 6.5 times the $13.448M spot volume on CoinGecko, so futures traders drive most of the trading. A sharp break of the band could force liquidations, meaning forced exits from borrowed-money positions.
Pieverse Technical Analysis: 50 EMA and RSI Levels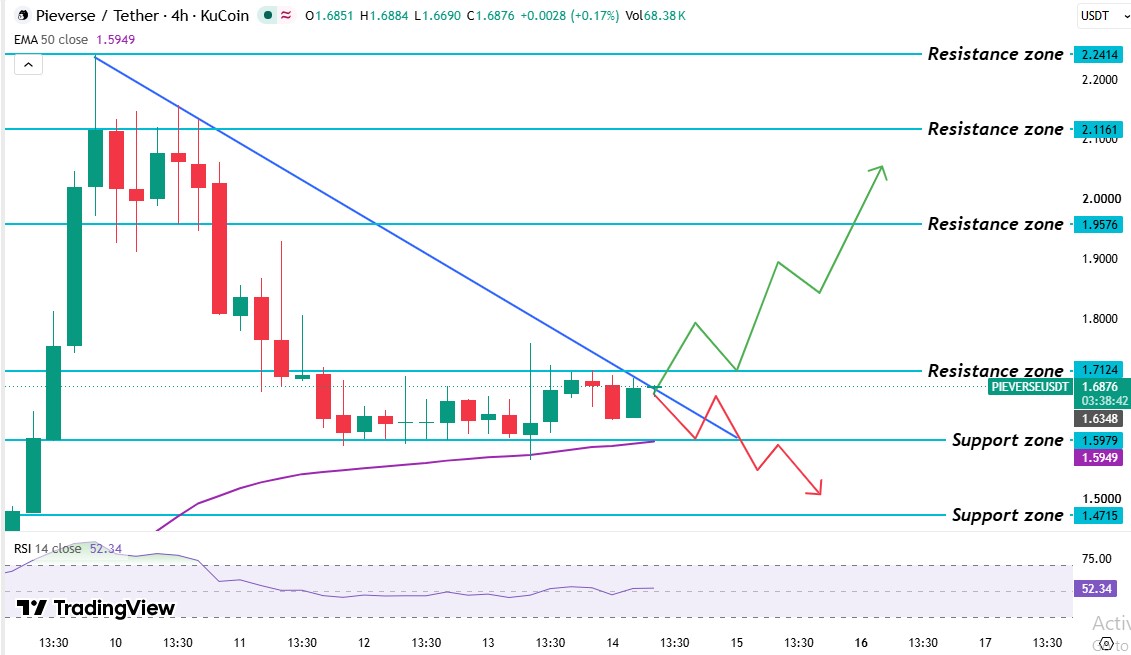
Source: TradingView, PIEVERSE/USDT 4H chart with EMA 50 and RSI 14, captured Nov 14, 2026, 10:30 UTC
The KuCoin 4-hour chart for PIEVERSE/USDT on TradingView frames this Pieverse price prediction, with each candle covering 4 hours. A November rally pushed Pieverse up to $2.2414 before sellers took control.
After the peak, the price stalled under the $2.1161 resistance level. Sellers then drove a sharp selloff, and a quick bounce failed under the $1.9576 resistance level. The price later settled into a range, a band held between the $1.5979 support level and the $1.7124 resistance level.
The market tried to break above $1.7124, but the spike failed. The blue falling trendline, a sloping line joining the lower highs since the $2.2414 peak, has capped each bounce so far. Those bands tie into the earlierrally levels guide for this token. Right now, the price trades above the support level, under the resistance level, and above the 50 EMA level, the average of the last 50 candles.
The Pieverse 50 EMA sits at $1.5949. Pieverse's $1.68 price trades 5.3% above it, and the latest candle trades above the EMA level too. The EMA and the $1.5979 support level sit almost together, so a daily candle trading below both would flip the read.
The Pieverse RSI reads 52.34 on the 14-period setting, down from an earlier peak above 70. Above 50 means buyers hold the edge, and above 30 means selling hasn't gone too far, so price still has room to fall.
Pieverse Support and Resistance Levels
Level
Type
$2.2414
Resistance level
$2.1161
Resistance level
$1.9576
Resistance level
$1.7124
Resistance level
$1.5979
Support level
$1.5949
50 EMA
$1.4715
Support level
Support levels and resistance levels are prices where the market has paused or reversed before. The nearest sites are at $1.7124 and $1.5979.
Pieverse Price Forecast: Bull, Base, and Bear Scenarios
Scenario
Trigger
Target
Invalidation
Bull
Daily candle trades above $1.7124
$1.9576, then $2.1161
Daily candle falls back below $1.7124.
Base
Price stays between $1.5979 and $1.7124.
Sideways trade inside that range
Daily candle breaks either level.
Bear
Daily candle trades below $1.5979
$1.4715
Daily candle trades above $1.7124
The biggest risk is supply, since the top 10 wallets hold 92.33% of market cap, and a single sale could overwhelm thin demand. Borrowed-money trading adds a second risk, because a break of the $1.5979 support level could trigger a fast flush of positions.
Pieverse Price Prediction: Expert Outlook
According to CoinGabbar analysis, the edge sits with buyers for now. The Pieverse RSI reads 52.34, and open interest rose on Binance, KuCoin, Gate, and Bybit.
But the falling trendline and the 92.33% top 10 wallet share keep conviction low. This Pieverse price prediction therefore favors a range until a daily candle trades above $1.7124. Traders should track the daily candle at $1.5979, since a daily candle trading below it hands control to sellers.
Disclaimer: This article is for information only and isn't financial advice. Traders should do their own research and risk only what they can afford to lose.
