Something shook POL awake this week, and then just as fast, it started slipping again. A stablecoin deal landed, whales moved, and the chart broke a pattern it had held for months. Now trader
Something shook POL awake this week, and then just as fast, it started slipping again. A stablecoin deal landed, whales moved, and the chart broke a pattern it had held for months. Now traders are asking the same question from two different angles: Was that the start of something bigger or the top of it? This Polygon price prediction walks through what actually happened, what the data says right now, and where this token could realistically be headed next.
Why Everyone Is Suddenly Talking About POL Again
The Polygon price prediction starts with a simple fact: POL is trading near $0.1093, down close to nine percent over the last 24 hours, after a sharp spike earlier in the week pushed it well above its recent range. That's not a quiet chart. That's a token that got attention and then gave some of it back.
Here's the thing: the move wasn't random. And it wasn't just chart noise either.
Polygon Price Prediction: Data (as of 15:17 UTC, August 27, 2026)
This section is data only, pulled straight from the source, with no interpretation yet.
Price: $0.1093, down 9.55% in 24 hours, perCoinMarketCap POL data
24h range: Low $0.1048, High $0.1216
Market cap: $1.16B, down 9.55%
24h trading volume: $157.63M, down 18.45%
Volume to market cap ratio: 13.47%
Circulating supply: 10.7B POL, close to max supply
All-time high: $1.29 (March 14, 2024), still down over 91% from that peak
All-time low: $0.06802 (July 1, 2026), POL now sits about 60% above that low
Holders: 251.6K wallets tracked by CoinMarketCap; 102,249 addresses on the Ethereum contract per Etherscan
Basically, this is a token that's still deep under its old highs but has clearly found a floor since July.
Why Is POL's Price Moving Today?
The fintech app confirmed it's rolling out EURR, a euro-backed stablecoin, and building it on Polygon, a move detailed in theRevolut euro stablecoin announcement posted this week. That's a real-world payments company choosing Polygon rails for a currency product used by millions of retail customers.
When we pulled up the reaction on-chain, the timing lined up almost exactly with POL's breakout candle earlier this week.
Polygon's own account has been pushing the stablecoin-wallet narrative hard lately too, telling followers that wallets aren't just for trading apps but for remittance, payroll, marketplaces, and subscriptions, basically any use case where money moves. That's a fundamental push, not just marketing fluff.
But then the pullback hit. 9% isn't nothing.
And that's the tension driving this whole Polygon price prediction: real adoption news on one side, profit-taking and leverage flush on the other. For a closer look at the earlier leg up, thewhy POL price moved up coverage breaks down that first spike in more detail. Support and resistance levels became the deciding factor almost overnight.
Polygon Price Prediction: Daily Chart Technical Analysis
On the daily chart, POL broke out of a descending channel it had been trading inside since February, a structure that had capped every rally attempt for months. That breakout matters, and it feeds directly into the ongoingbreakout or fakeout debate around this chart. It's the first clean structural shift in a long stretch of grinding sideways trades.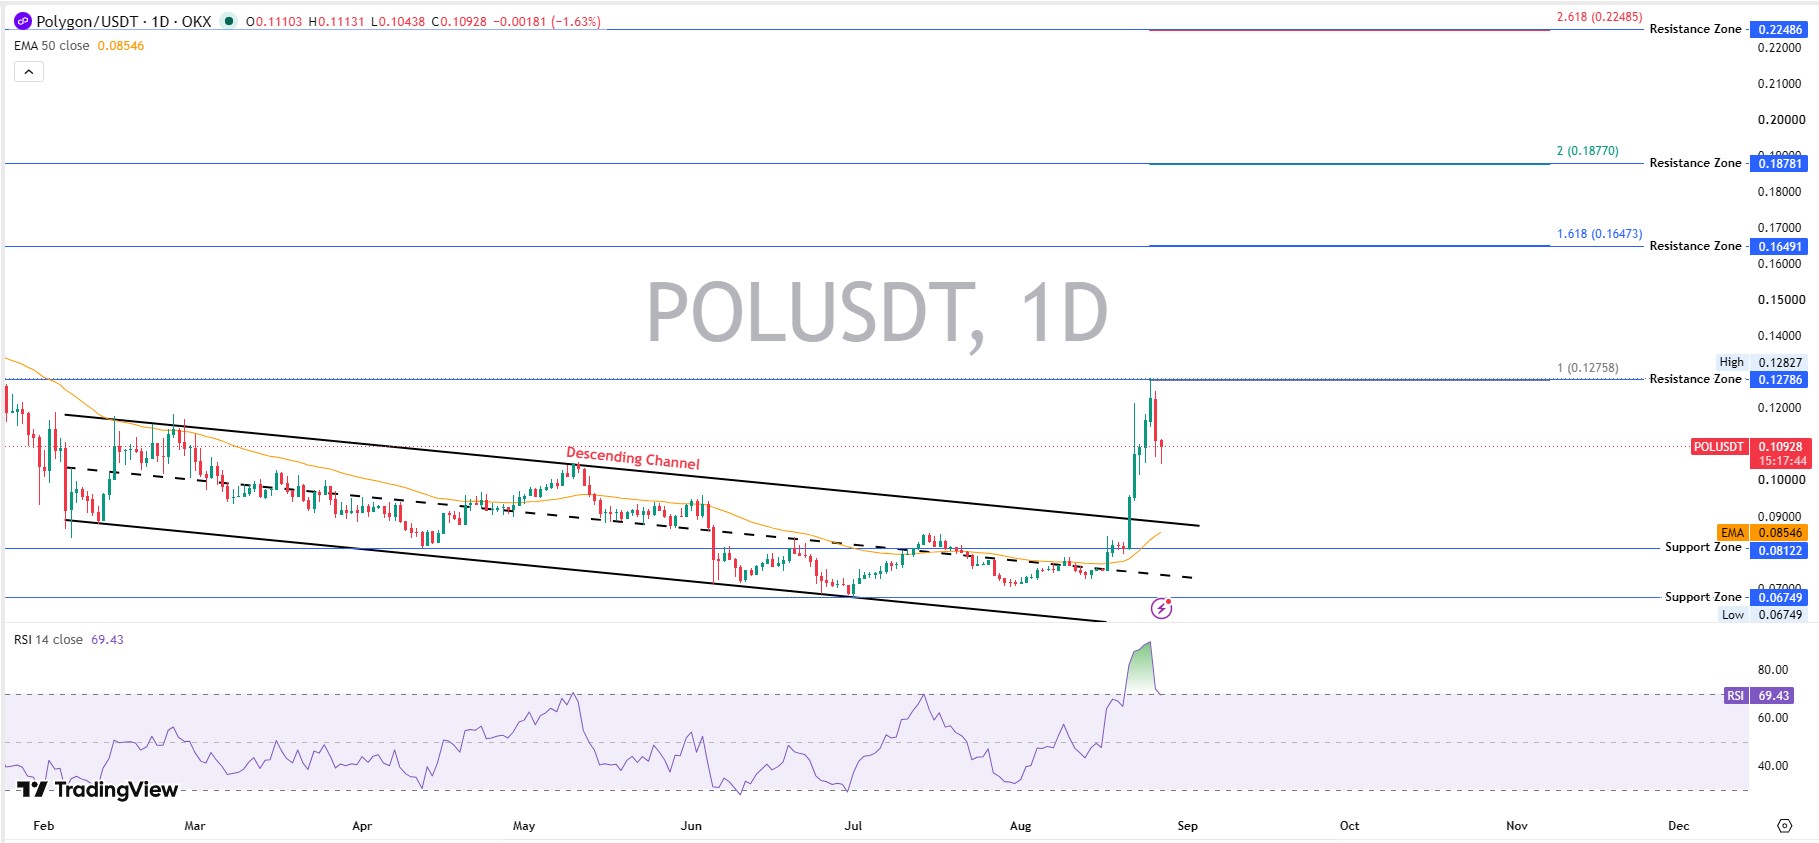
Price spiked toward the $0.1279 resistance zone before fading back near $0.1093, visible on thePOL/USDT daily chart, which is a normal reaction after a fast move, not necessarily a failure.
The 50-day EMA sits around $0.0855, well below current trades, which keeps the broader trend tilted bullish for now. RSI on the daily reads 69.43, just under overbought, meaning momentum is strong but stretched.
Above, resistance zones sit at $0.1279, then $0.1649, then $0.1878, and $0.2249 further out. Below, support zones cluster at $0.0812 and $0.0675. As long as trades hold above the channel breakout line, the bullish momentum narrative stays intact.
Whale Concentration and On-Chain Structure
ThePolygon token holder data on Etherscan shows the top 10 wallets control roughly 80.42% of the supply, and the top 100 wallets hold 96.48%. Whale concentration alone sits at 97.89%.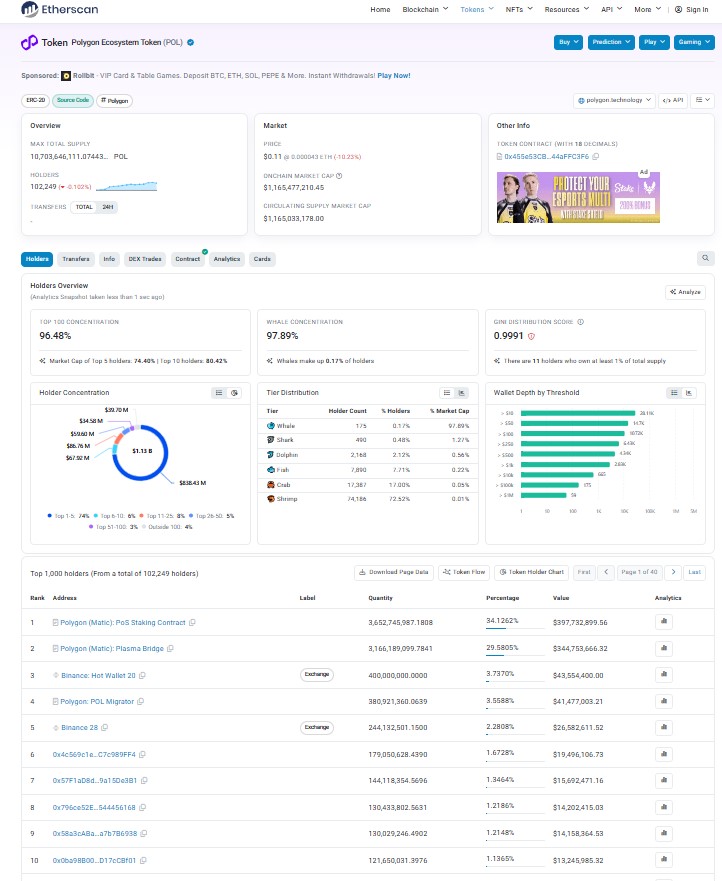
Most of that isn't a red flag by itself since the largest holder is the Polygon PoS staking contract at 34.13%, followed by the Plasma Bridge at 29.58%, both structural, not speculative, wallets.
Still, when we looked past the staking and bridge contracts, exchange wallets like Binance hold meaningful chunks too. Concentration patterns like this show up across other new listings too, and thetokenomics presale structures piece breaks down why that risk isn't unique to POL. The Gini distribution score sits at 0.9991, about as concentrated as it gets for a token this size.
Liquidations, Trading Volume and Market Sentiment
ThePOL liquidation heatmap on CoinGlass shows $327.80K in total liquidations over 24 hours, with $230.19K coming from long positions and $97.62K from shorts. That lines up with the price drop. Traders who bet on continuation got squeezed out.
Spot and futures volume stayed heavy despite the pullback. Binance led with $54.53M, LBank followed at $42.69M, OKX brought in $18.97M, and Bybit added $14.96M.
Total trading volume across major venues topped $150M in a single day, a sign that market sentiment around POL, bullish or not, is still active and liquid.
Polygon Price Prediction: Altcoin Market Context
POL doesn't move in a vacuum. It's an altcoin, and altcoins take cues fromBitcoin price trend shifts, risk appetite, and sector-specific news.
The Revolut stablecoin integration puts Polygon in the real-world-payments corner of the altcoin market, a category that's been drawing steady attention through 2026 as fintech firms look for settlement rails outside traditional banking. Sentiment in that corner often tracks the same waymemecoin market news does, rising and falling with overall risk appetite rather than fundamentals alone.
That positioning helps. But altcoins in this bracket also correct hard once momentum fades, and traders watching adjacent sectors throughAI crypto news will recognize the same pattern. POL's chart history backs that up.
Polygon Price Prediction: Bear, Base, and Bull Scenarios
Timeframe
Bear Case
Base Case
Bull Case
Probability
Invalidation
7 Days
$0.0950
$0.1150
$0.1350
Bear 30% / Base 45% / Bull 25%
Daily trades close below $0.0955
30 Days
$0.0800
$0.1300
$0.1650
Bear 25% / Base 45% / Bull 30%
Weekly trades close below $0.0812
Early 2027
$0.0675
$0.1900
$0.2800
Bear 20% / Base 40% / Bull 40%
Structural break below $0.0675 support
What Could Invalidate This Polygon Price Prediction
If POL's trades slip back below the $0.0812 support zone and stay there, the whole breakout thesis falls apart, and the descending channel could reassert itself.
Broader macro risk plays a part too. Fresh developments around theClarity Act senate vote could pull sentiment fast, regardless of Polygon-specific news.
Trade tensions matter here too. RenewedUS-Iran trade tensions have rattled risk assets before, POL included. A large wallet dumping supply near resistance would weigh heavily as well. Fine. That's the honest risk list.
Conclusion
This Polygon price prediction comes down to a tug of war. Adoption news is genuinely bullish. Leverage, flush, and whale concentration are genuinely risky.
We'd call the setup cautiously constructive above $0.0812 and clearly bearish if that level breaks. For a longer-range view beyond this week's swing, theAugust 2026 forecast lays out where POL stood before this move started.
Is the breakout real or just a news-driven spike? That's the question the next few trading sessions will answer. Readers comparing setups across the market can also check thelatest price predictions hub for other tokens moving today.
Disclaimer
This article is for informational purposes only and does not constitute financial advice. Cryptocurrency trades are highly volatile and carry significant risk. Always do your own research and consult a licensed financial advisor before making investment decisions.