Something odd is happening on Robinhood Chain: $PONS just tore through its old range in days. Can this breakout actually hold? PONS Breakout Rally Meets a Make or Break Level Every so often a
Something odd is happening on Robinhood Chain: $PONS just tore through its old range in days. Can this breakout actually hold?
PONS Breakout Rally Meets a Make or Break Level
Every so often a token shows up out of nowhere and rewrites its own chart in a week. That is basically what $PONS is doing right now.
The Pons price prediction conversation has shifted fast this week. A few days ago this was a quiet launchpad token, and now it just posted afresh all-time high that put it on everyone's radar.
Launchpad tokens do not usually move this cleanly. But $PONS broke a multi-week ascending channel and never looked back.
Trading volume exploded alongside the price, and that combination rarely happens by accident. Whales noticed first.
So what actually changed, and can this bullish momentum hold through the next test? Keep that question in mind as we go through the numbers.
Where Is $PONS Trading Right Now
As of roughly 15:30 UTC on September 01, 2026, $PONS is trading near $0.44, according to CoinMarketCap data pulled directly from the market.
The token is up over 34 percent in the past 24 hours alone. That is a sharp single-day move for any asset.
Market cap sits around $314 million, also up over 34 percent on the day. Fully diluted valuation is closer to $444 million.
Trading volume over the last 24 hours came in near $118.81 million, up more than 46 percent. The volume-to-market-cap ratio is 36.68%, which is unusually high, echoing the move covered in an earlierburn and rally update. 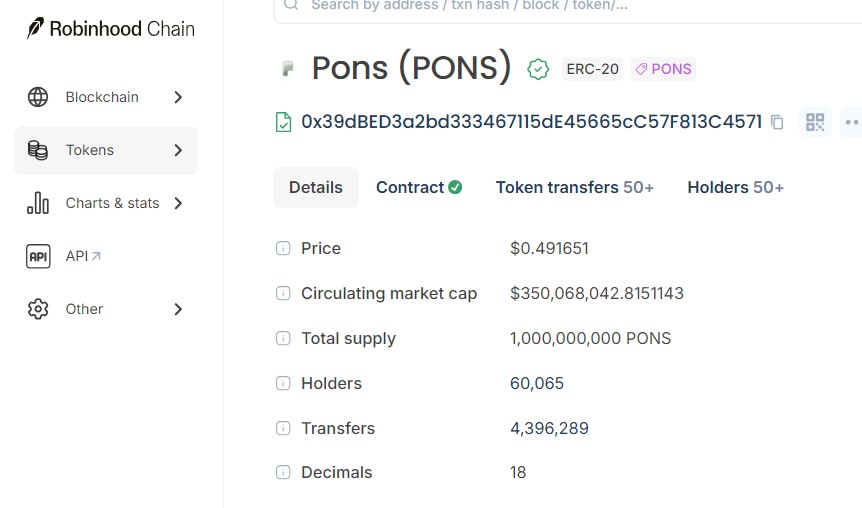
On-chain data from theRobinhood Chain explorer shows PONS trading closer to $0.49, with over 60,000 holders and more than 4.3 million transfers recorded so far.
Why Is PONS Price Moving Today
Turns out, this rally has a real catalyst behind it, not just hype.
The Pons team posted that the protocol had the highest fees paid by any launchpad onchain over the last 24 hours, tied to more than $500 million in volume in a single day. Token creators alone have now earned over $25 million in trading fees, payable in stock tokens, ETH, or USDG, based on theofficial Pons post on X.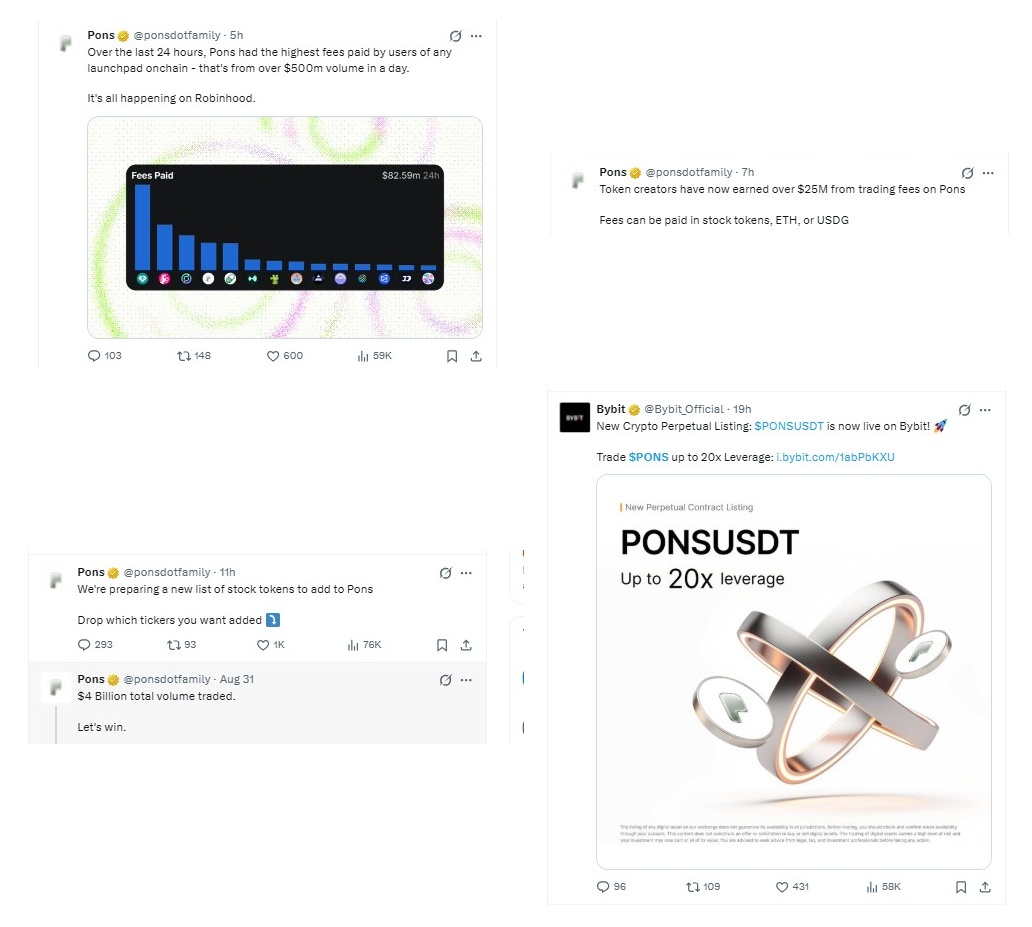
And that is not the only trigger.Bybit listed PONSUSDT perpetual contract with leverage up to 20x, opening the door to a much wider pool of traders.
Total volume traded across the protocol has now crossed $4 billion, building on theRWA push coverage from earlier this week. That is a big number for a token this young.
Put those two things together, fresh derivatives access plus a record of on-chain fee activity, and you get the kind of market sentiment shift that shows up directly on thedaily chart analysis.
Daily Chart Analysis and Technical Structure
The daily chart tells a pretty aggressive story right now.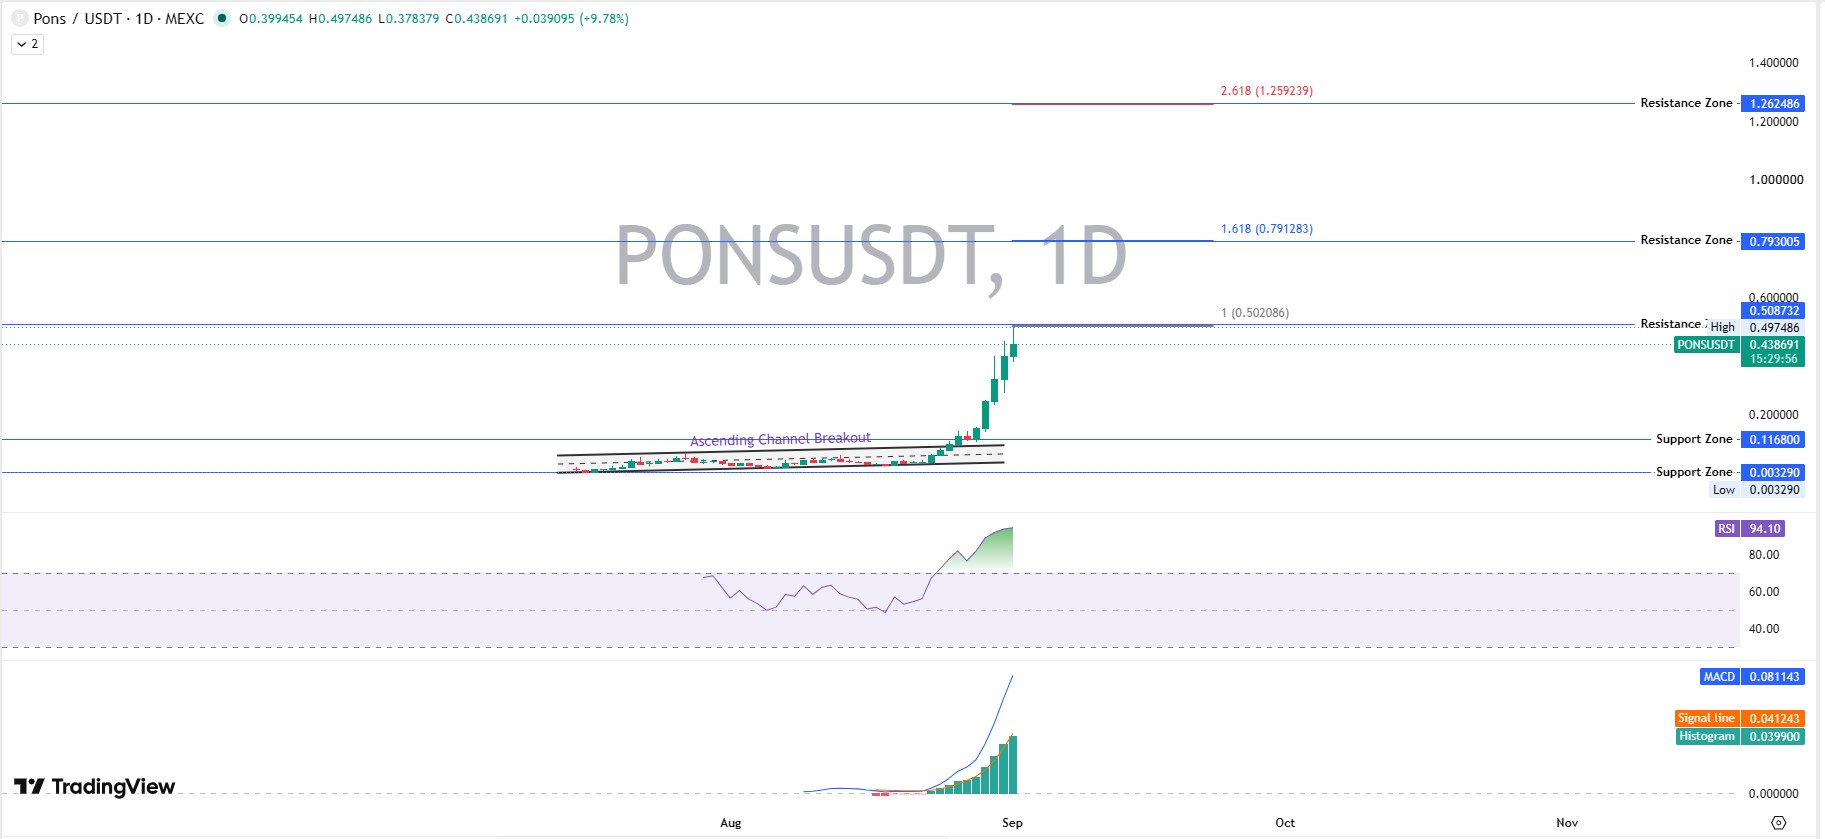
PONS broke out of an ascending channel that had been forming for weeks, then accelerated hard into early September. The last trading candle printed a high near $0.4975 before pulling back slightly to trade around $0.4387.
RSI is sitting at 94.10. That is deeply overbought territory, not a gray area.
MACD remains firmly positive too, with the MACD line at 0.081 sitting above the signal line at 0.041 and the histogram still expanding at 0.0399. Momentum has not cracked yet.
But an RSI reading this extreme rarely holds for long without some kind of cooldown. We have seen this pattern before in fast-moving launchpad tokens.
Support and Resistance Levels to Watch
Immediate resistance sits near $0.497 to $0.509, right where the price is currently trading.
Above that, the next major resistance zone lines up near $0.793, then a much bigger target near $1.262 if bullish momentum truly extends.
On the downside, the first real support zone sits around $0.117, well below where price trades today. A deeper support layer near $0.0033 marks the low of the entire move.
Liquidation Data and Market Sentiment
Here is where things get a little tense.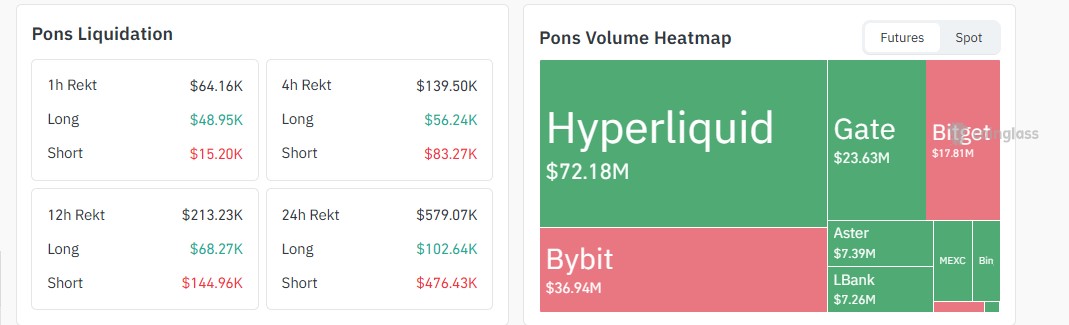
Coinglass data shows $579.07K in total liquidations over the past 24 hours, with short sellers taking the bigger hit at $476.43K against $102.64K in long liquidations.
That tells us shorts have been getting squeezed hard as PONS pushed higher. But the 4-hour window shows longs starting to take losses too, $56.24K worth, which hints the market may be getting two-sided.
Trading volume is concentrated heavily on Hyperliquid at $72.18M, followed by Bybit at $36.94M and Gate at $23.63M. That spread across venues suggests this is not a single exchange pump, and it lines up with the pace of freshcrypto exchange listings PONS has picked up recently.
PONS as a Launchpad Altcoin: What Makes It Different
PONS is not a meme play. It is an altcoin built as a launchpad token on Robinhood Chain, where fee revenue and stock token integrations are the actual product.
That distinction matters for any long-term price outlook. Fee-generating altcoins tend to hold value differently than pure hype tokens because there is a revenue mechanism underneath the price action, not justairdrop speculation.
The team is also actively expanding, recently asking the community which stock tickers to add next, according to theirlatest update. Traders tracking the rollout can follow it through thecoin events calendar for upcoming integrations. Or it could mean nothing changes at all. We will not know until it happens.
Pons Price Prediction: Bear, Base, and Bull Scenarios
Timeframe
Bear Case
Base Case
Bull Case
Probability
Invalidation
7 Days
$0.28
$0.42
$0.51
Bear 30 / Base 45 / Bull 25
Trading below $0.35
30 Days
$0.18
$0.39
$0.79
Bear 30 / Base 40 / Bull 30
Trading below $0.117 support
Early 2027
$0.12
$0.55
$1.26
Bear 25 / Base 40 / Bull 35
Loss of the $0.003 low, or a fee-revenue collapse
What Could Invalidate This Forecast
A drop below the $0.35 zone would break the current breakout structure fast.
And if fee revenue from the launchpad slows down, the entire narrative behind this Pons price prediction weakens with it. Regulatory friction around stock tokenized assets is a real risk too, and the ongoingClarity Act developments are worth watching for how that risk plays out.
Is this rally sustainable at RSI 94? Fine, probably not without a cooldown first.
Disclaimer
This article is for informational purposes only and does not constitute financial, investment, or trading advice. Cryptocurrency markets carry significant risk. Always do your own research and consult a licensed financial advisor before making any investment decisions.