Pons just had a wild day. A surge of 20% in 24 hours on burn hype but down 3% right now, tied to reports that roughly 31% of PONS supply has been retired through burns, with volume topping $1
Pons just had a wild day. A surge of 20% in 24 hours on burn hype but down 3% right now, tied to reports that roughly 31% of PONS supply has been retired through burns, with volume topping $123 million.
But not everyone's convinced yet, with traders calling out another rejection and saying PONS needs to reclaim its zone before it can push back above $1.
This Pons price prediction checks which side the chart actually backs.
Market data was checked on September 16, 2026, at 03:48 UTC.
Pons Price Prediction Today: Market Overview
Metric
Value
Price
$0.58387
24h Change
-3%
Market Cap
$404.31M
FDV
$404.33M
24h Volume
$118.32M
Vol/Mkt Cap (24h)
29.25%
Liq/Mkt Cap
7.49%
Total Supply
687.58M PONS
Max Supply
687.61M PONS
Circulating Supply
687.58M PONS
Holders
94.35K
Source: Data from CoinMarketCap as of September 16, 2026, at 16:21 IST. Figures may vary slightly across other tracking websites.
Pons News Today: PONS Surges 20% on Burn Buzz
@BingXOfficial reported that PONS jumped 20% in 24 hours, tied to burn expectations heating up after roughly 31% of supply was reportedly retired, with trading volume hitting $123 million or more.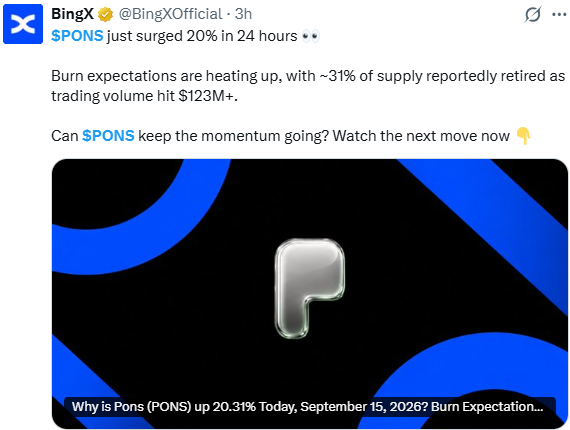
Source: Data From X
CoinGabbar could not independently verify the exact burn percentage beyond what's stated in the post.
PONS Chart Rejection: Crypto News Today
In today's crypto news, @cryptoknight890 pointed out that PONS is facing another rejection and hasn't broken out yet, arguing that reclaiming the current zone could send the price quickly back above $1.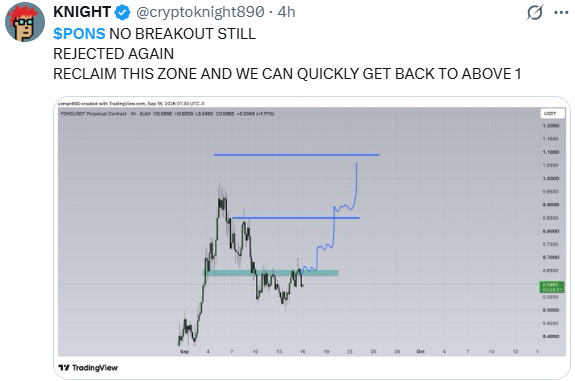
The post's own chart shows PONS pulling back from a resistance band after testing it multiple times.
PONS Technical Analysis: Price Chart and EMA Levels
Pair: PONS/USD · Market: Spot (Crypto) · Timeframe: 4H · Source: TradingView · Timestamp: September 16, 2026, 05:48 UTC-3
PONS is trading at $0.58387, down 0.99% on the candle, pulling back after breaking above its descending trendline earlier this week.
The PONS EMA levels sit just above price, with the EMA 20 at $0.60554 and the EMA 50 at $0.61098 both acting as the immediate resistance to reclaim.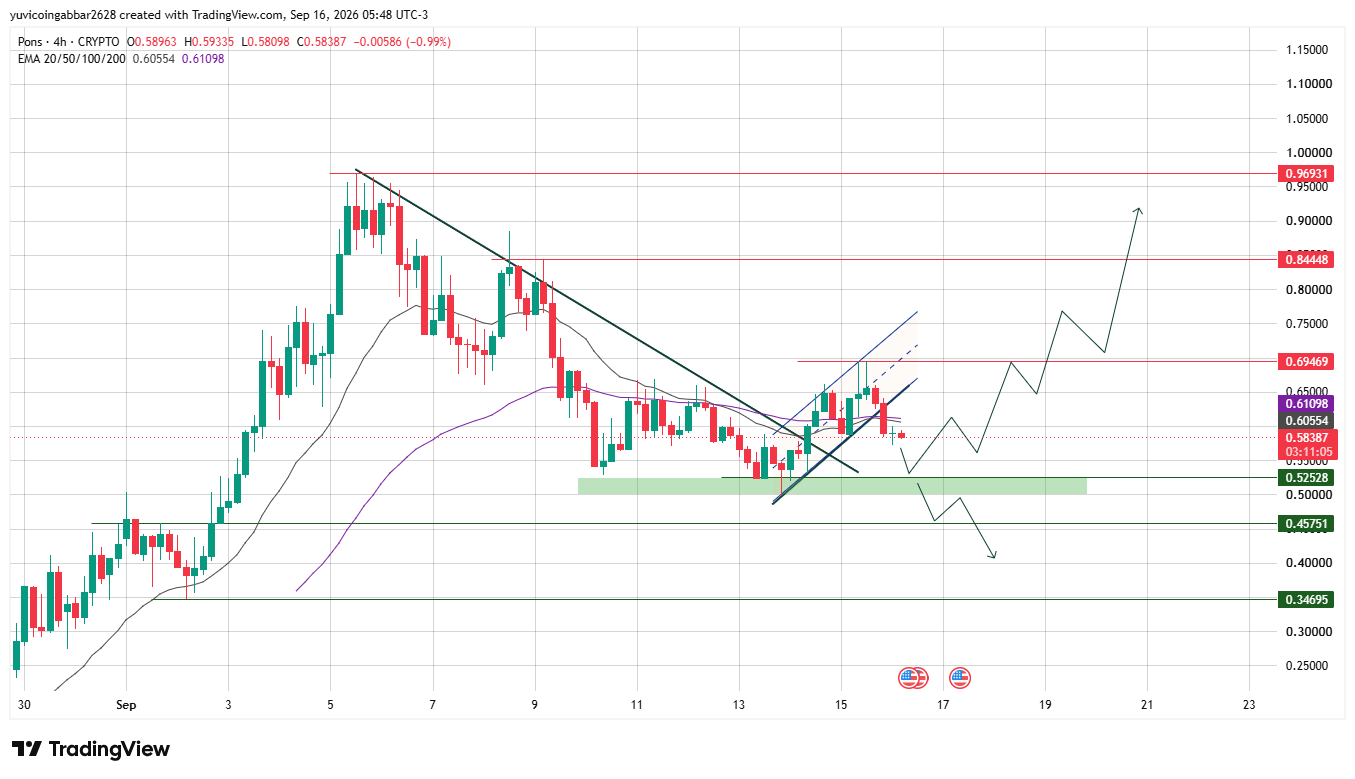
PONS Support and Resistance Levels: Pons Forecast Zones
Level Type
Price
Resistance 3
$0.96931
Resistance 2
$0.84448
Resistance 1 (nearest)
$0.69469
Immediate Price Reference
$0.58387
EMA 20 (near resistance)
$0.60554
EMA 50 (near resistance)
$0.61098
Support Zone
$0.52528
Deeper Support
$0.45751
Structural Floor
$0.34695
Pons Forecast: Bull Case vs Bear Case
Bull case: Reclaiming the EMA cluster at $0.60554 to $0.61098 would confirm the trendline breakout, opening the path toward $0.69469 and then the $0.84448 resistance band, with $0.96931 as the stretch target if burn-driven demand keeps building.
Bear case: A failure to reclaim the EMA cluster and a slide back into the $0.52528 support zone would suggest the rejection holds, with $0.45751 and the structural floor at $0.34695 as deeper levels if selling continues.
Triggers & Invalidation
Scenario
Trigger
Likely Outcome
Invalidation Point
EMA reclaim
Clears $0.60554–$0.61098
Push toward $0.69469
Rejection at EMA cluster
Support hold
Holds above $0.52528
Range-bound before next attempt
Close below $0.52528
Breakdown
Loses $0.52528 zone
Deeper pullback toward $0.45751
Structural floor tested
Can PONS Reach $1?
The Knight's call for a push "above 1" lines up closely with the chart's highest marked resistance at $0.96931.
Reaching it would require PONS to first reclaim the EMA cluster near $0.60554 to $0.61098, then clear $0.69469 and $0.84448 in sequence, a multi-stage recovery rather than a single move.
Pons Price Prediction: Expert View
According to CoinGabbar analysts, The burn narrative gives PONS a fresh demand story, and the surge in volume backs that up, but the chart still shows price rejected below its EMAs.
The $0.60554 to $0.61098 zone is the level that decides whether this turns into a real reclaim or another failed attempt.
Disclaimer
This piece is for informational purposes only and isn't financial advice. The levels and scenarios above are based on technical chart analysis and publicly available data at the time of writing, and crypto markets can move sharply within hours, so past patterns don't guarantee future outcomes. It's worth doing independent research and considering your own risk tolerance before acting on any of the levels discussed here.