PONS price prediction searches spiked this week after the native asset of the Robinhood Chain ecosystem posted a 50%+ daily move on top of an already parabolic first ten days of trading. It's
PONS price prediction searches spiked this week after the native asset of the Robinhood Chain ecosystem posted a 50%+ daily move on top of an already parabolic first ten days of trading. It's part of a broader pattern: this cycle of new launchpad assets moving fast right out of the gate, not unlike the setup covered in Solana's eTrade listing price prediction.
This isn't a token with years of chart history to lean on; PONS only launched roughly ten days ago through the Robinhood Launchpad, but the early data already tells a distinct story: explosive volume, a heavily concentrated holder base, and a community betting hard on a "V2" upgrade. Is this sustainable momentum for a brand-new launchpad asset or a classic new-listing blow-off? Here's what the numbers show.
Why PONS Is Back On Traders' Radar
PONS jumped more than 50% in 24 hours, changing hands around $0.0407, while trading volume on the pair stayed heavy relative to its size. The token is the flagship asset tied to the Robinhood Chain ecosystem and trades primarily against WETH on Uniswap V3, with live pair data visible on thePONS Uniswap trading pair.
This is a launchpad token still just over a week old, so the usual caveats around new listings apply. Total supply sits at 1 billion PONS, though snapshots differ on how much is currently circulating. Some trackers show the full 1 billion already live; others show closer to 790.7 million, a gap worth watching as more supply potentially enters circulation. The move also lines up with the wider risk-on mood described inthe crypto market rally today.
Token Contract
Contract Address: 0x39dBED3a2bd333467115dE45665cC57F813C4571 Standard: ERC-20 Chain: Robinhood Ecosystem Category: Launchpad token
Full contract details, transfers, and holder history are viewable on theRobinhood Chain token explorer.
Key Takeaways
PONS trades near $0.0407 as of July 24, 2026, up roughly 50–54% in 24 hours.
The token is about 17% below its all-time high of $0.04879, set just two days ago on July 22, 2026.
It's up more than 1,100% from its all-time low of $0.003317, set July 17, 2026, a week ago.
4-hour chart resistance sits at $0.04399, with a bigger wall at $0.05958. Support sits at $0.02547, with a deeper zone near $0.01417.
4-hour RSI reads 61.12; weekly RSI trends similarly elevated but not yet overbought.
Market cap sits around $31.5–32.2M, with fully diluted valuation near $32–40M depending on the circulating supply figure used.
Liquidity sits around $1.5M against a $1.3M TVL, which is thin for the volume this token is doing.
24-hour volume runs from roughly $6M to $14M depending on the source tracked, with net buy pressure positive over the last day.
Holder count has grown to roughly 16,500 addresses in just over a week.
Where PONS Stands Right Now
PONS last traded around $0.0407, up in the 50–54% range over the past 24 hours depending on the feed, perPONS live price data. The 7-day range has been extreme for a token this young: a low of $0.004513 up to a high matching the all-time high of $0.04879.
Circulating supply figures diverge across trackers; one shows the full 1 billion PONS already circulating, another shows 790.711 million circulating against a 1 billion max supply. Either way, market cap sits in the low $30M range, with fully diluted valuation not far above that, meaning there isn't a massive unlock overhang priced in yet, though the gap between trackers is worth confirming before sizing a position. That contrasts with the dilution pressure discussed in theEthereum 2026 price outlook around scheduled token supply changes.
The all-time high of $0.04879 was set just two days ago, on July 22, 2026. The current price sits roughly 17% below that peak, a much shorter distance from highs than a mature token would typically show, consistent with a coin still in its early price-discovery phase. The all-time low of $0.003317 was set only a week ago, on July 17, 2026, meaning the current price is up over 1,100% from launch-week lows.
What's Driving PONS's Price Today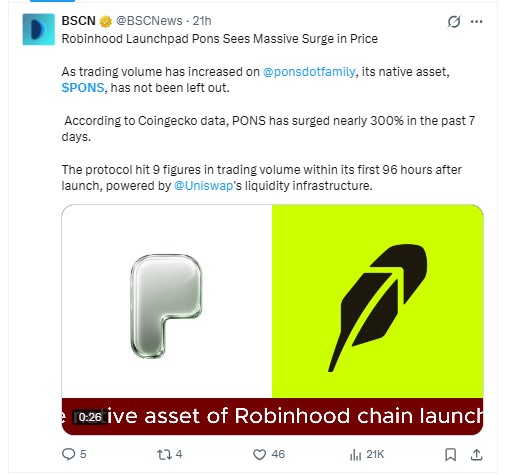
Two threads are feeding this move. First, trading activity on the Robinhood Launchpad has been climbing steadily, and PONS, as the ecosystem's native asset, is capturing that flow.BSCNews's report on Pons noted the protocol crossed nine figures in trading volume within its first 96 hours after launch, powered largely by Uniswap's liquidity infrastructure, a pattern also visible in recentSolana price momentum coverage.
Second, the project's own social channels have been building anticipation for a "V2" upgrade. The Pons V2 announcement thread references real-world assets (RWAs) and fees paid in ETH as coming features, describing PONS as the platform of choice for Robinhood Chain traders and adding a narrative layer on top of the raw trading volume.
Together, that's a fresh-launch momentum trade layered on top of genuine ecosystem-growth headlines, not unlike the launch-window hype tracked around Pepeto's presale countdown, a combination that can move fast in both directions.
Technical Analysis: 4-Hour Chart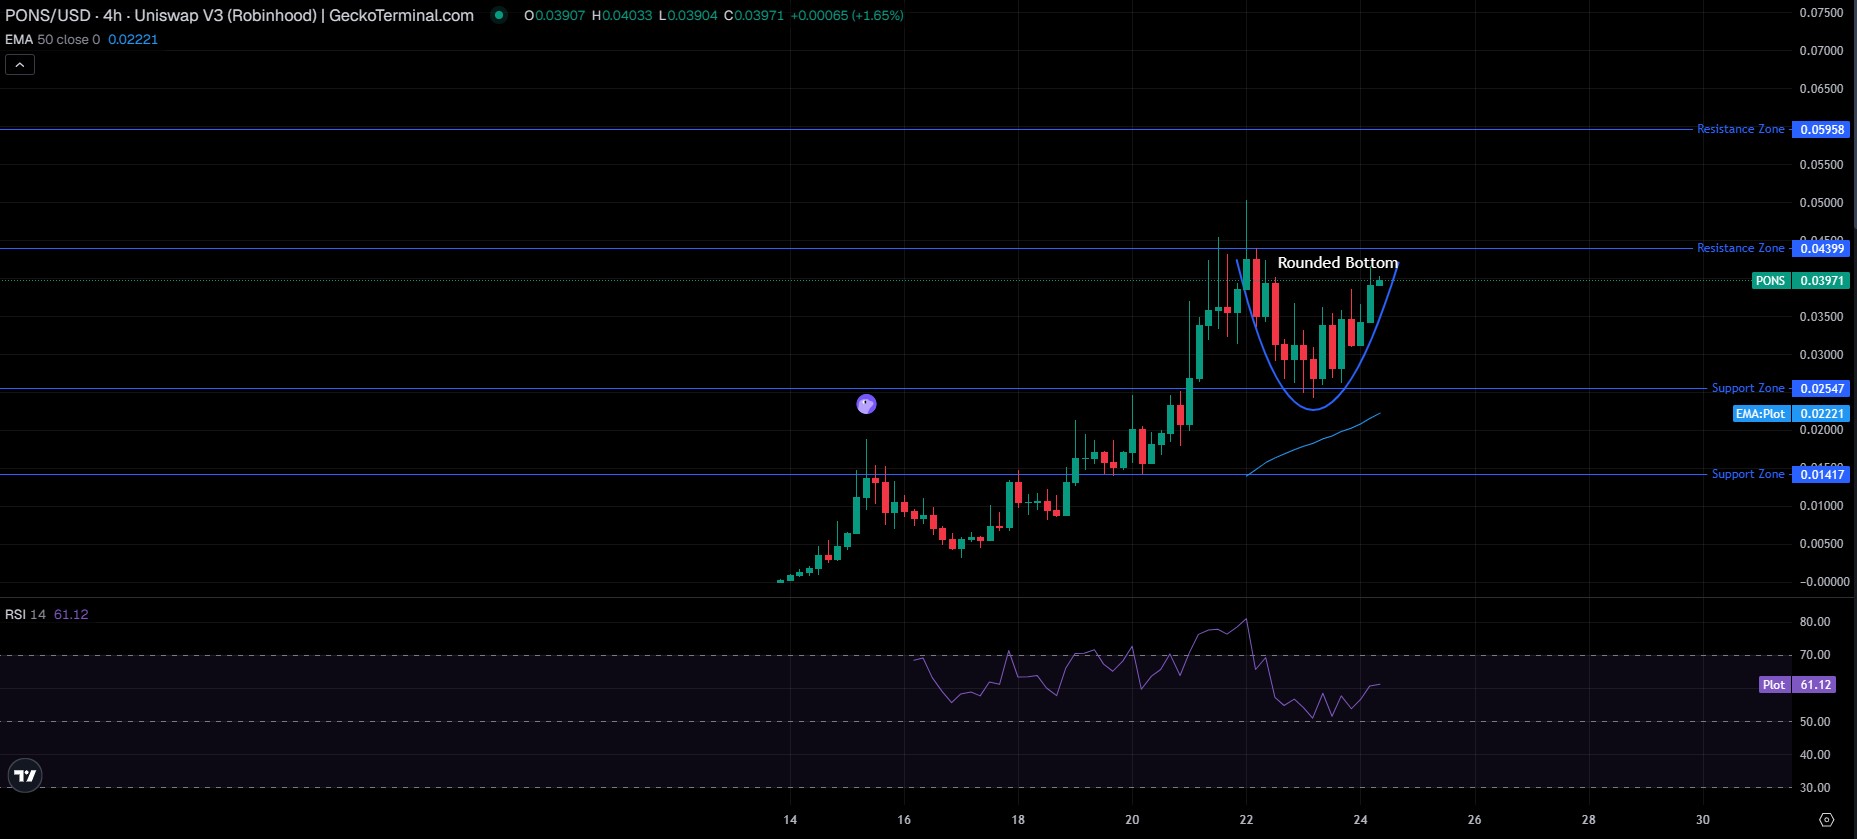
The 4-hour PONS/USD chart on Uniswap V3 shows a clear rounded-bottom recovery pattern: price consolidated in the $0.03000–$0.03500 zone for roughly two days before breaking higher.
The 50-period EMA sits at $0.02221, well below the current price, a bullish trend signal, though the wide gap also suggests price has moved a long way, fast. RSI on the 4-hour chart reads 61.12, elevated but with room before overbought territory, according to thePONS chart on GeckoTerminal.
Resistance sits at $0.04399, just above the current price, with a bigger zone at $0.05958. Support sits at $0.02547, backed by a deeper floor at $0.01417, a resistance-rejection setup similar to the one flagged in theXRP resistance rejection analysis.
Support and Resistance Snapshot (4H)
Level TypePriceResistance 2$0.05958Resistance 1$0.04399Current Price$0.04071Support 1$0.02547Support 2$0.01417
Technical Analysis: Weekly Chart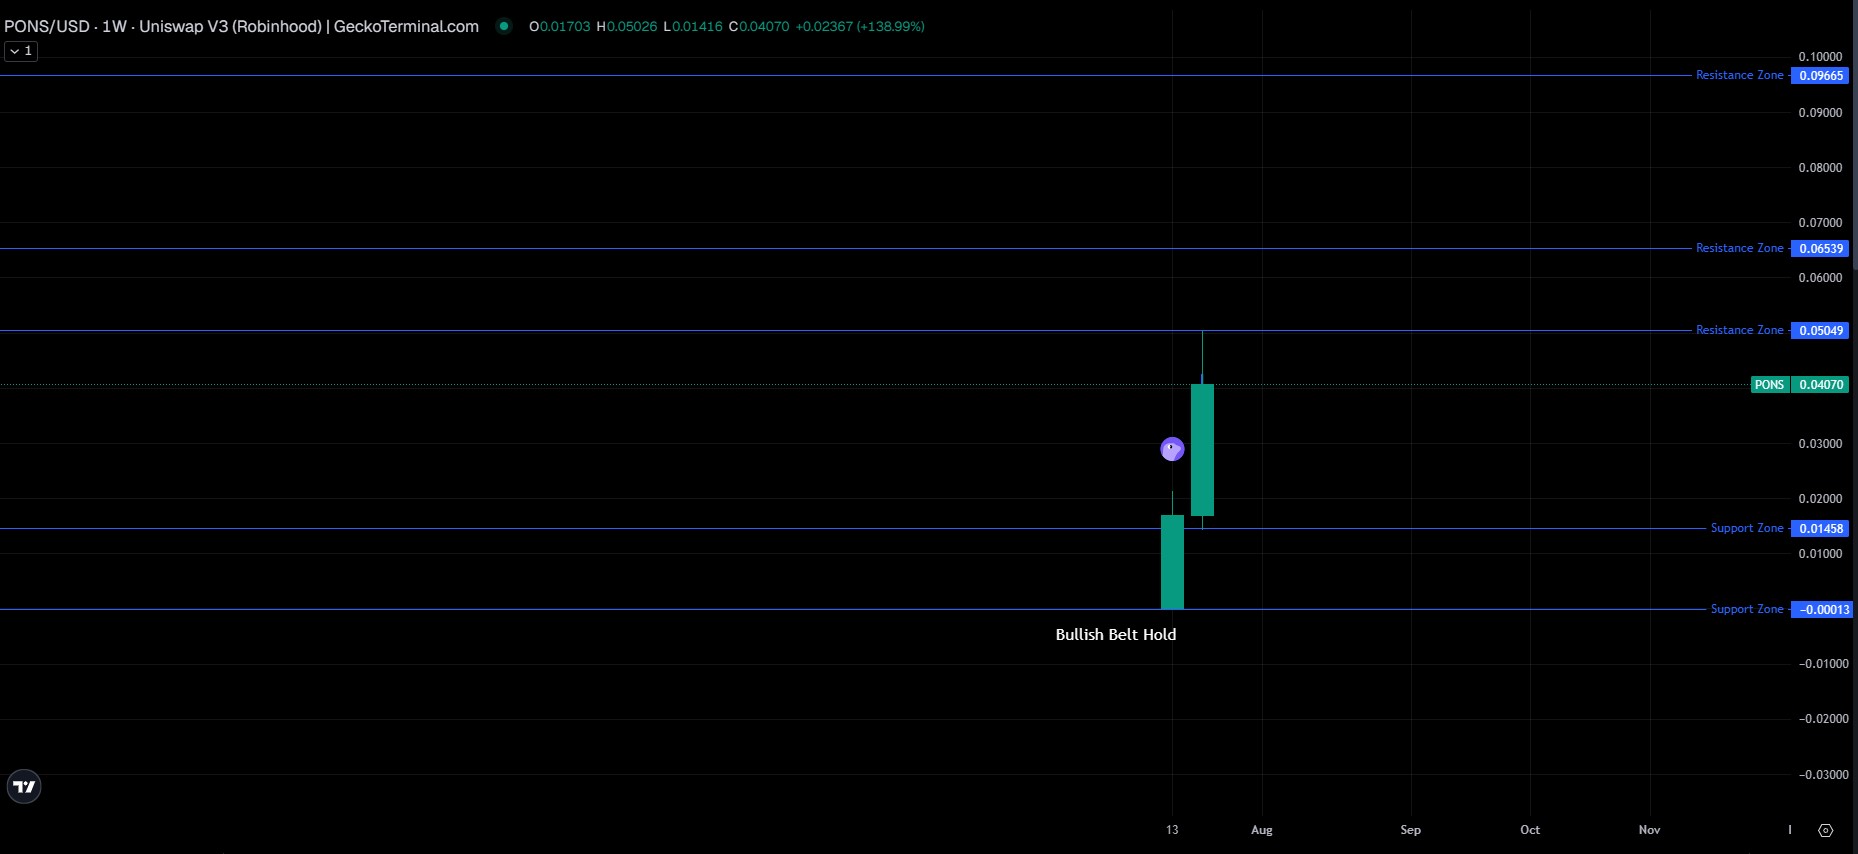
The weekly chart is dominated by a single "Bullish Belt Hold" candle; price opened at $0.01703, ran up to a high of $0.05026, dipped to a low of $0.01416, and closed near $0.04070, a nearly 139% weekly gain. That's the entire trade. history of the token so far, so this chart should be read as a launch chart, not a mature trend.
Weekly resistance levels sit at $0.05049, then $0.06539, and then $0.09665 further out, per the samePONS chart on GeckoTerminal on its weekly timeframe. Support underneath sits at $0.01458, with a lower zone effectively near zero, a reminder that a token this young has no proven floor yet, unlike the multi-year structure discussed in theBitcoin price forecast.
Support and Resistance Snapshot (Weekly)
Level TypePriceResistance 3$0.09665Resistance 2$0.06539Resistance 1$0.05049Current Price$0.04070Support 1$0.01458
Tokenomics and Holder Concentration
Total supply is fixed at 1 billion PONS. Holder count has grown quickly, from roughly 16,500 to over 16,600 addresses depending on the snapshot for a token barely over a week old.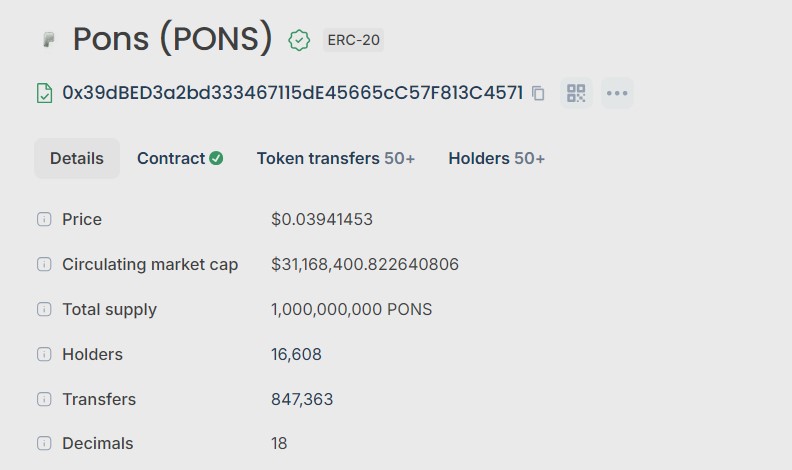
Concentration is high, as expected for a fresh launch. The top 10 wallets control about 39.04% of the supply, addresses 11–30 hold 16.25%, addresses 31–50 hold 9.68%, and the remaining wallets share 35.03%.
Notably, the single largest holder is a burn address holding roughly 26.5% of the supply; tokens are permanently removed from circulation rather than a whale sitting on sell pressure, as confirmed on the Robinhood Chain token explorer. The next-largest holder is the Uniswap V3 liquidity pool itself, at just over 2%, reflecting normal DEX custody rather than a personal wallet.
Beyond those two, individual wallet concentration drops off quickly, with the next ten largest holders each controlling roughly 1–1.6% of supply. Some of those early wallets are sitting on unrealized gains north of 1,000%, a whale-accumulation pattern worth watching in the same way theXRP whale-accumulation data has been tracked, a real source of potential sell pressure if sentiment turns.
Liquidity and Volume
Liquidity sits around $1.5M against a $1.3M TVL, thin relative to the volume the token has been doing; daily volume has ranged from roughly $6M up to $14M+ across different tracking windows on thePONS Uniswap trading pair. That kind of volume-to-liquidity ratio means price can move sharply on relatively modest order flow in either direction, which lines up with the size of the recent swings, a dynamic also shaped by protocol-level flows like the ones covered in the Uniswap fee buyback update.
Bull, Base, and Bear Scenarios
These are scenario-based estimates from the current chart structure, not guarantees or financial advice, framed similarly to theBitcoin bull-bear base case outlook.
Bull Case: A clean break above $0.04399 opens a path toward $0.05958, and a weekly close above $0.05049 could extend the move toward $0.06539. Probability: moderate, roughly 30%, contingent on Robinhood Chain volume and V2 hype staying in headlines.
Base Case: Price consolidates roughly between $0.025 and $0.045 as the initial launch volatility cools and the market searches for a real range. Probability: highest, roughly 45%.
Bear Case: Momentum fades and price retraces toward the $0.02547 support zone, with a deeper test of $0.01417 possible if early holders start taking profits. Probability: roughly 25%.
Price Forecast Table
TimeframeBearBaseBull24H$0.032$0.040$0.0487D$0.025$0.038$0.05530D$0.015$0.035$0.0752026 (Year-End)$0.008$0.030$0.120
Key Risks
Extremely limited trading history. With roughly a week of real chart data, there's no proven support/resistance structure the way an established token would have, unlike the longer-running setups discussed in theBitcoin-Ethereum rotation trade.
Circulating supply ambiguity. Trackers disagree on whether the full 1 billion supply is already circulating, which affects how market cap and FDV should be read.
Holder concentration among non-burn wallets. Beyond the burn address and LP pool, several early wallets are sitting on very large unrealized gains, a source of potential sell pressure.
Thin liquidity relative to volume. A $1.5M liquidity pool against multi-million-dollar daily volume means slippage risk on larger orders, a risk profile comparable to sharp drawdowns like the one covered in theIran truce crypto crash report.
Narrative dependence. Much of the current momentum is tied to anticipation around a "V2" upgrade that hasn't shipped yet; failure to deliver could remove a key catalyst. Worth tracking alongside the broadercrypto events calendar for any confirmed dates.
Glossary
RSI (Relative Strength Index):A 0-100 momentum indicator. Above 70 typically signals overbought; below 30 signals oversold.
EMA (Exponential Moving Average): A trend-following average weighting recent prices more heavily.
FDV (Fully Diluted Valuation):What the market cap would be if all tokens were circulating.
TVL (Total Value Locked):Assets deposited in a protocol's liquidity pools.
Burn Address:A wallet with no known private key, used to permanently remove tokens from circulation.
Disclaimer: This article is for informational purposes only and does not constitute financial advice. Cryptocurrency markets, and newly launched tokens in particular, are highly volatile. Always do your own research and consult a licensed financial advisor before making investment decisions.