Is a 274% monthly run quietly running out of air? That's the question hanging over QNT at $237.37, down 6.18% in a week. This Quant price prediction tests whether the pullback is a pause or a
Is a 274% monthly run quietly running out of air?
That's the question hanging over QNT at $237.37, down 6.18% in a week. This Quant price prediction tests whether the pullback is a pause or a warning, building on theearlier Quant support analysis.
Short answer: bears hold the edge for now. But the chart isn't broken yet.
Quant Price Today: Market Data Snapshot
Figures reflect 09:40 UTC on October 12, 2026.
Metric
Reading
$QNT price
$237.37
24h change
-1.06%
7d change
-6.18%
30d change
+273.99%
24h range
$235.41 to $245.35
Market cap
$2.86B
24h spot volume
$89.93M
All-time high
$428.38
Quant price today reads $237.37, and spot volume slipped 15.04% in a day, perCoinMarketCap data. That's thin turnover for a coin up 273.99% in 30 days.
Why Is $QNT Moving Today?
$QNT is drifting. Volume is fading. Nothing dramatic is driving it.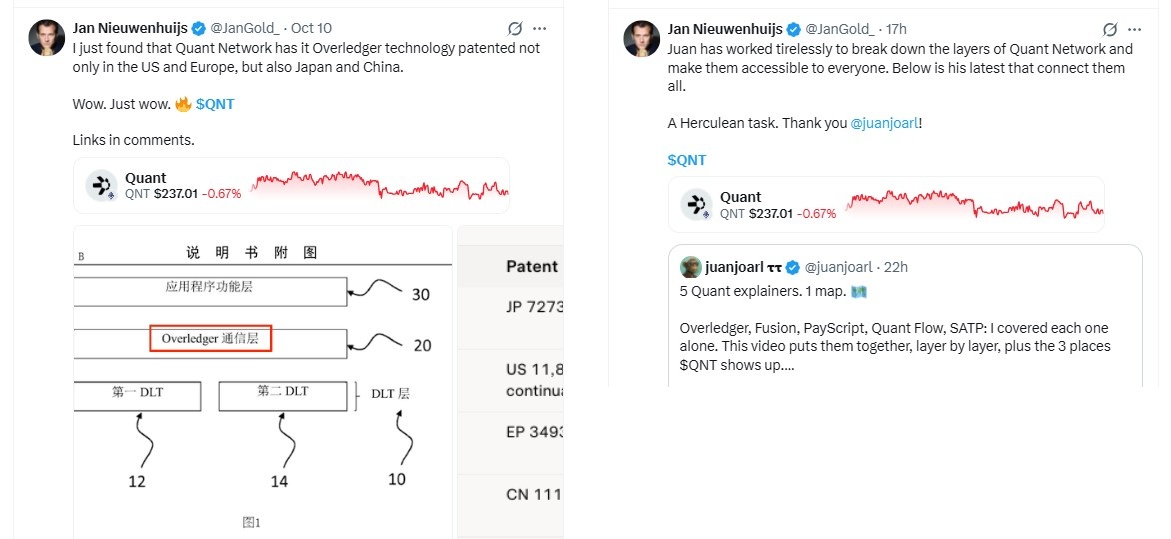
Analyst Jan Nieuwenhuijs flagged Overledger patents across the US, Europe, Japan, and China on October 10. A second post on October 11 shared five Quant explainers. Useful reading, not a deal.
And the price barely reacted. Earlier coverage in thealtcoin breakout watchlist had already put $QNT among three coins to watch.
$QNT Technical Analysis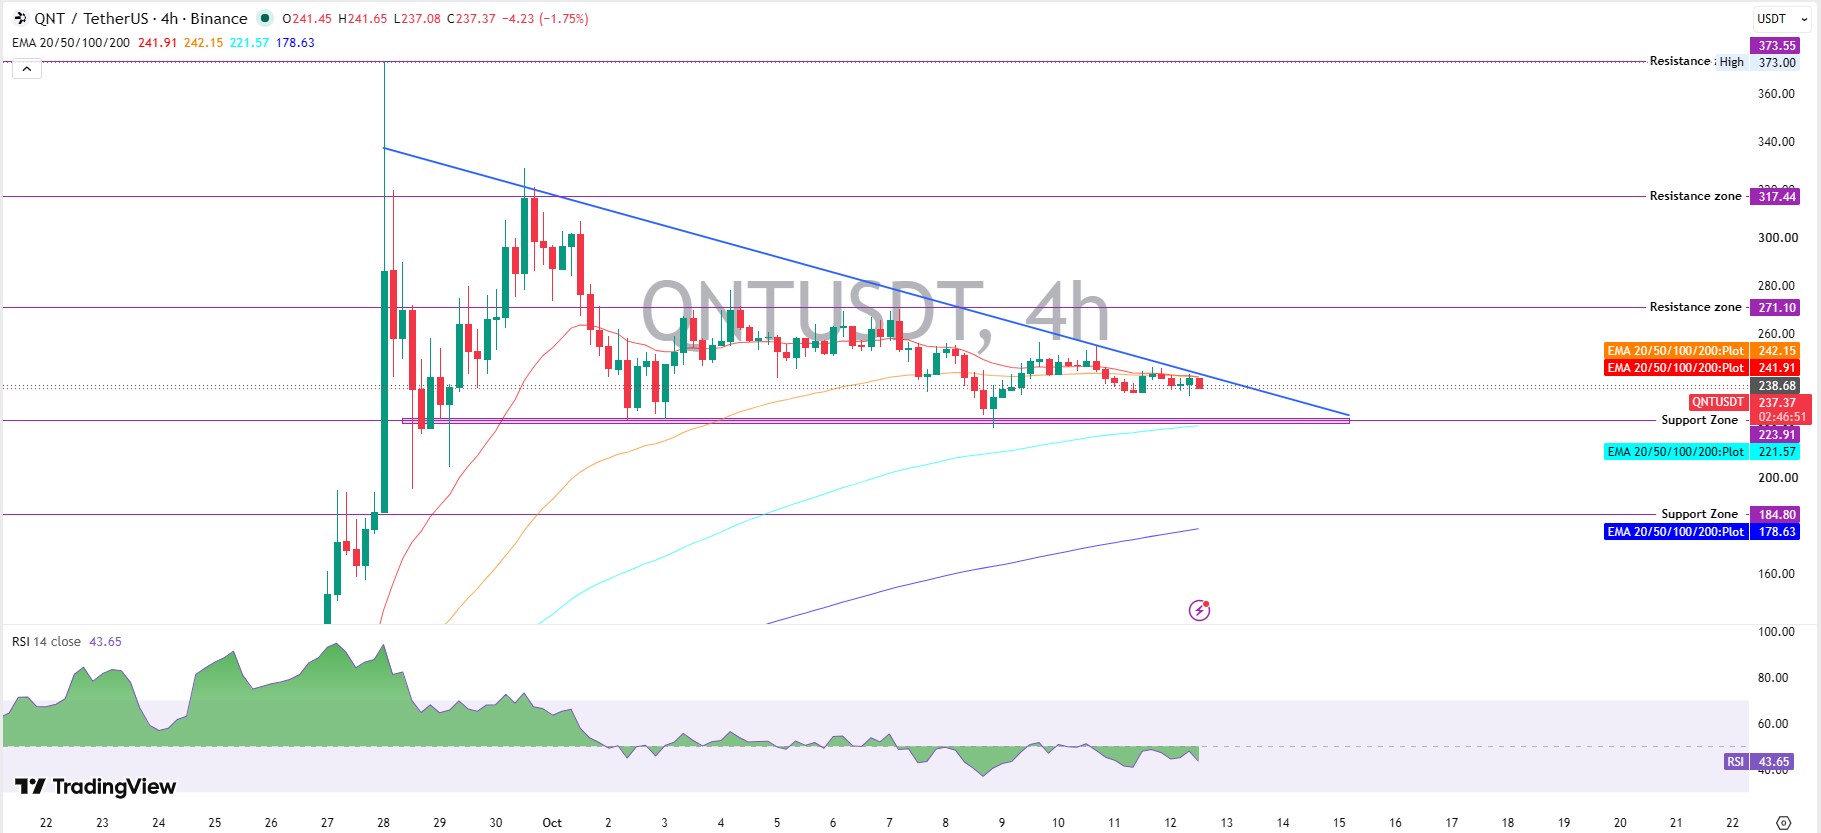
The 4-hour TradingView chart on Binance shows a descending triangle. A falling trendline pressing down, and flat support near $223.91 pushing back.
Price sits under the 20-EMA at $241.91 and the 50-EMA at $242.15. An EMA is a moving average that weights recent trading more heavily.
RSI reads 43.65. Bears hold the edge. Actually, that's too quick, because the 100-EMA at $221.57 sits right under support. And that stacks two floors together.
$QNT Support and Resistance Levels
QNT support and resistance zones cluster tightly.
Type
Level
Support
$223.91, $221.57, $184.80
Resistance
$242.15, $271.10, $317.44, $373.00
That puts the$262 breakout setup on hold, with $271.10 now the bigger test.
Derivatives Data: Are Traders Long or Short?
CoinGlass futures data shows a Binance long/short ratio of 0.9183, so shorts slightly outnumber longs. OKX reads 2.14, a heavy long tilt.
Open interest, the total value of open futures bets, stands at $134.01M. Futures volume hit $430.38M. Liquidations reached $219.55K in 24 hours. And longs took $148.89K of it.
$QNT Supply and Market Cap
Circulating supply is 12.07M of a 14.88M max, so roughly 81% is already out. Fully diluted value reads $3.53B. QNT is an ERC-20 token, so broader Ethereum sentiment is worth tracking in theEthereum price outlook.
Whale Concentration on Etherscan
Etherscan holder data shows the top 100 wallets control 74.68% of supply. The Gini score is 0.9756, where 1 means one wallet owns everything. Four holders each own over 1%. But thin ownership cuts both ways.
Quant Price Prediction: Bull Case
Bulls need a push above the 50-EMA near $242.15. And above the falling trendline, with rising volume. Then can $QNT reach $271.10? It becomes a fair question. But volume has to confirm it.
Under this scenario, the first $QNT price target is $271.10, then $317.44 if buyers hold. Invalidation comes under $223.91. A steady market helps, so theBitcoin price outlook deserves a check.
$QNT Price Prediction: Base Case
Base case: QNT chops between $223.91 and $242.15 with a downward tilt. Sideways drift like that is explained in thesecrypto trading terms. A short-term QNT price prediction hinges on that squeeze. So who blinks first?
$QNT Price Prediction: Bear Case
A breakdown under $223.91, plus the 100-EMA at $221.57. That would turn the chart weaker, and QNT could then slide toward $184.80, about 22% lower.
The rally leaned on institutional headlines like those in thebank deal outlook. Quieter news removes that tailwind.
Quant Price Prediction 2026: Year-End Outlook
For Quant price prediction 2026, a range from $184.80 to $317.44 fits the current structure. Bull, base, and bear paths above sit inside it.
Any QNT price forecast this far out depends on adoption and liquidity more than chart lines. Othercrypto price forecasts show the same limits.
What Could Change the Outlook?
A confirmed partnership, exchange listing, or product launch could shift momentum fast. Upcoming dates sit on thecoin events calendar. Heavy futures activity means liquidations can amplify any move.
Risks That Could Change the Quant Price Prediction
Concentrated wallets, thin spot volume, and futures-led trading make this $QNT price prediction fragile. Attention also rotates, for example towardAI token coverage.
Final Takeaway
This Quant price prediction leans bearish while the price trades under $242.15. A hold above $223.91 keeps the triangle alive. And a breakdown opens $184.80. Patience beats guessing here.
Disclaimer: This article is for informational purposes only and is not financial or investment advice. Cryptocurrency markets are highly volatile, and prices can change within minutes. Data reflects 09:40 UTC on October 12, 2026, and may change.