Key Takeaways Binance ETH perp volume hit 5.57M units vs 290K spot – Perp-Spot Imbalance at 0.90, near ATH. 30-day Z-score of 2.53 confirms the derivatives-spot divergence is historically abn
Key Takeaways
- Binance ETH perp volume hit 5.57M units vs 290K spot – Perp-Spot Imbalance at 0.90, near ATH.
- 30-day Z-score of 2.53 confirms the derivatives-spot divergence is historically abnormal.
- Binance ETH open interest reached a new all-time high of 3.7M ETH, holding 44% market share.
- Weekly Taker Buy/Sell Ratio moved from 0.95 to 1.16, buy-side flow has caught up with sellers.
On Binance, ETH perpetual futures volume has reached approximately 5.57 million units while spot market volume sits at just 290,000 units. The ratio between the two has pushed the Perp-Spot Imbalance indicator to 0.90, near its all-time high. The 30-day Z-score of 2.53 confirms this divergence is not a temporary fluctuation. A Z-score above 2.0 means the current reading sits more than two standard deviations above the recent historical mean, and statistically, this is significantly outside normal market behavior.
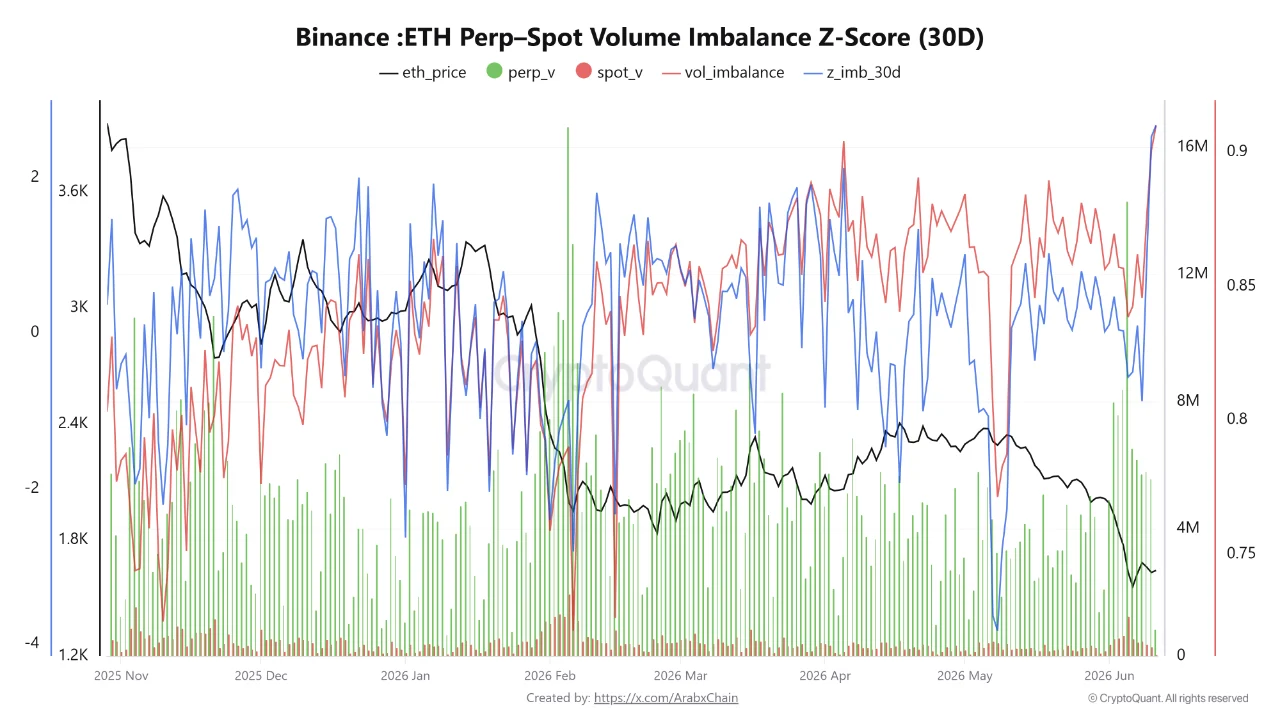
In plain terms: the overwhelming majority of ETH trading activity on Binance is currently happening through leveraged derivatives contracts, not through people actually buying or selling the underlying asset. That distinction matters because derivatives volume does not represent genuine supply and demand. It represents leveraged bets on price direction, and those bets need to be settled one way or another.
What Perp-Spot Imbalance and Z-Score Actually Mean
The Perp-Spot Imbalance is a ratio comparing perpetual futures trading volume to spot trading volume on the same exchange. When the ratio is low, most activity happens in the actual asset, with organic buyers and sellers determining price. When the ratio climbs toward 1.0, derivatives activity is almost entirely dominating price discovery.
A Z-score measures how far a current reading deviates from its historical average, expressed in standard deviations. A Z-score of 2.53 means the current imbalance sits 2.53 standard deviations above its 30-day mean, a reading that in a normal distribution would occur less than 1% of the time. In market terms, this confirms the derivatives-spot divergence is historically abnormal, not just elevated. The risk this creates is mechanical. When derivatives dominate spot activity by this margin, the market becomes extremely sensitive to position unwinds. A relatively small price move can trigger a cascade of liquidations, automated stop-losses and margin calls that then accelerate the move further in either direction. The actual supply and demand picture gets buried under layers of leveraged positioning, making price action harder to read as a signal of genuine conviction.
Open Interest at an All-Time High, Into Weakness
According to CryptoQuant’s ETH open interest data, Binance has recorded a new all-time high with nearly 3.7 million ETH now positioned in futures contracts on the platform. Binance’s share of total Ethereum open interest has simultaneously crossed 44%, cementing its dominance in the ETH derivatives market.
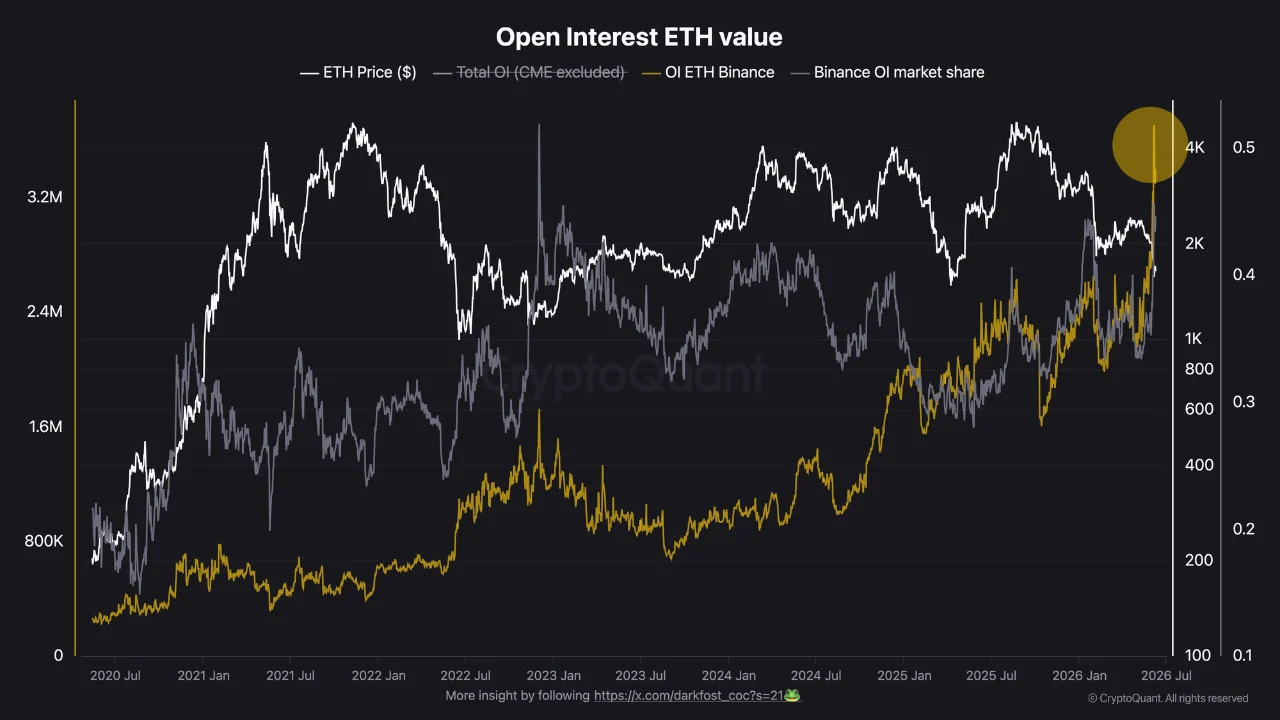
Open interest measures the total number of outstanding futures contracts that have not been settled. A rising open interest figure means new money is entering the derivatives market, with traders opening positions rather than closing them. At 3.7 million ETH, this represents a historically significant level of leveraged exposure concentrated on a single exchange.
The context makes the data notable. Open interest typically climbs alongside price, as traders add leverage into strength to amplify momentum. The current setup inverts that pattern. Leverage is being added into weakness, with ETH trading near multi-year lows around $1,650.
The supply context behind that price level is covered in detail in a separate Coindoo analysis, which documents how exchange reserves have fallen from 21 million to 14.5 million ETH over the same period despite the price decline.
That inversion has two possible explanations: traders collectively believe the bottom is in and are positioning for a recovery, or they are adding leverage at a structurally fragile price level where a failure to hold could trigger a violent unwind.
READ MORE:
 Ripple Launches XRPL AI Starter Kit for Autonomous Payments
Taker Buy/Sell Ratio: The One Bullish Signal in the Data
The positioning data contains one directional shift worth isolating. According to CryptoQuant’s Taker Buy/Sell Ratio, the weekly average on Binance moved from 0.95 to 1.16, meaning buy-side flow has pulled even with selling pressure after months of seller dominance.

The Taker Buy/Sell Ratio measures the ratio of aggressive buy orders to aggressive sell orders in the derivatives market. A ratio below 1.0 means sellers are more aggressive than buyers, initiating trades at the bid.
A ratio of exactly 1.0 means the two sides are in equilibrium, while a ratio above 1.0 means buyers are more aggressive than sellers. The move from 0.95 to 1.16 indicates that buy-side flow has not just recovered, but is now meaningfully outpacing selling pressure. With traders actively hitting the ask to open long positions rather than waiting on the sidelines, the data suggests the market is treating these multi-year price lows as an accumulation opportunity rather than a warning sign.
This is the one data point in the set that tilts directionally positive. It does not override the structural risk flagged by the Perp-Spot Imbalance, but it does suggest the leverage being added at these levels is predominantly long-biased rather than short-biased.
What the Data Cannot Resolve
These two readings, record open interest at multi-year price lows and a taker ratio shifting toward buy-side equilibrium, describe the same market from different angles and reach different conclusions.
The open interest and imbalance data signal structural fragility. A market running at a 0.90 Perp-Spot Imbalance with a 2.53 Z-score has historically preceded sharp, fast moves when leverage gets unwound. The mechanism is not directional. Liquidation cascades can run in either direction depending on which side of the trade gets squeezed first.
The taker ratio data signals nascent accumulation. Traders moving from net-sell to net-neutral in derivatives flow, while open interest reaches an all-time high, could reflect genuine contrarian positioning by participants who believe current prices represent value. Which interpretation proves correct depends on one variable the on-chain data cannot supply: whether spot demand follows the derivatives positioning. If genuine buyers enter the spot market and absorb sell pressure, the long-biased open interest could act as fuel for a sharp recovery. If spot demand fails to materialize and price breaks lower, the same open interest becomes the accelerant for a liquidation cascade. The data identifies the setup. It does not resolve the outcome.
The information provided in this article is for educational and research purposes only. On-chain and derivatives metrics do not guarantee future price performance. Digital assets involve extreme volatility and risk of loss. This content does not constitute financial or investment advice.
The post Record ETH Leverage on Binance: Contrarian Bet or Liquidation Setup? appeared first on Coindoo.